The report: U.S. Bank Branch Closures and Banking Deserts (February 2024) Related interactive U.S. map, “Banking Deserts Dashboard”
Source: Federal Reserve Bank of Philadelphia
Why we picked it: The timing of the release of this research couldn’t have been better, by focusing on another side of the current U.S. bank branching debate.
We dug right into the Philadelphia Fed’s report in the wake of our coverage of the branch extension strategies of PNC, JPMorgan Chase and Frost Bank and about the debate between branch advocates and digital believers over the role and rationale for branches today.
The term “banking desert” goes way back— to the 1870s, according to one source. Definitions have varied from one study to another in recent years (We’ll get into how the Philadelphia Fed study authors define the term — which is significant.) Broadly, today “banking desert” means an area with inadequate banking service, mainly due to a lack of bank branches.
The term “desert” has acquired a certain currency in socioeconomic studies, which have looked at “food deserts,” “book deserts,” “medical deserts,” and “transit deserts.” Often these deserts occur in disadvantaged areas. But the Fed study brings a more nuanced — even at times counterintuitive — picture into focus when it comes to banking.
As our coverage has underscored, in recent years banks have revamped branches and “optimized” their networks, and even added branches as they enter new markets or bolster existing markets. But there are also places where banks fold their tents.
Banking desert studies tend to be published in the wake of major economic events. A rash of attention to banking deserts followed the 2007-2008 financial crisis, for example. The most recent round — other parts of the Fed system as well as other organizations have also published research on the matter — was triggered by trends in the wake of the pandemic.
The extensive statistics in the study are based on calculations the authors made using numbers from the S&P Global Market Intelligence SNL U.S. Bank Branch Data set. Only full-service branches and retail banking branches were included. Specialized and in-store branches and ATM locations were not.
Executive Summary
The Great Recession ushered in an ongoing trend of closures of branches of depository institutions. Covid gave downsizing another hearty push.
“This existing trend was exacerbated at the onset of the Covid-19 pandemic. Since 2020, the pace of bank branch closures across the country has doubled,” the study reports. The research compares branch conditions in December 2019, pre-pandemic, to conditions in mid-2023. The analysis includes both bank and credit union branches.
Notably, losses of branches happened much more often among large institutions (those with assets of $10-$50 billion) and very large institutions (assets of $50 million and up). Large banks closed 11% of their locations and very large banks closed 12.6% in 2019-mid-2023. Among very large institutions with the greatest net branch closures were Truist, Wells Fargo, PNC, Bank of America and U.S. Bancorp.
In contrast, smaller banks — those under $10 billion — actually grew branches slightly, by 1.1%. And credit unions hardly closed anything at all — only 0.1% of their offices.
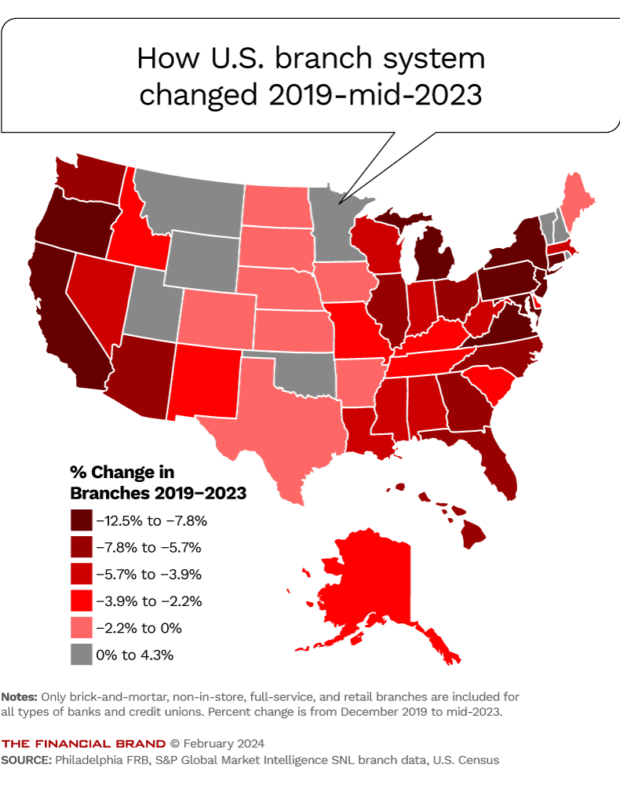
Overall, during the study period the entire U.S. branch system shrank by 5.6%.
The proliferation of digital banking services makes it hard to weigh the impact of closures, especially because the pandemic’s lockdown period accelerated digital adoption. “Nonetheless, lowered access to physical bank branches may impede banking service access for some populations, particularly those facing other barriers to banking services or those who rely on in-person banking for accessibility reasons,” the report says.
Indeed, the study looks not only at how various demographic segments are affected by closures, but also at how closures affect banking services in areas that lack adequate broadband service or low access to digital devices. Data exists to track both factors and the report correlates it with branch closures.
“While the popularity of online banking has skyrocketed, physical banking still plays an important role in some communities,” according to the study. “Many lower-income, rural, older, and disabled consumers still prefer to bank with a teller. … Physical branches are also more conducive to personal relationships with bankers…”
The five states seeing the largest decrease in branches relative to 2019 totals included Virginia (down 12.5%), Maryland (down 12.1%), New Jersey (down 11.7%), Oregon (down 9.9%) and Pennsylvania (down 9.8%).
All types of markets saw decreases in branches during the study period: Rural markets were down 4.2%, suburban down 6%, and urban down 6.1%.
Read more: Moves By Chase and PNC Re-ignite the Branch Versus Digital Debate
Key Takeaways
• Significant branch system net shrinkage and growth in banking deserts happened in higher-income, suburban and mostly white communities.
• That said, locales with high concentrations of people with lower incomes, Asians, Blacks, racially diverse neighborhood makeup, and the disabled lost branches “at a disproportionate rate.”
• Both low- and moderate-income (LMI) and middle- and upper-income (MUI) communities saw a net fall in branches. Just over 70% of the losses occurred in the MUI areas — but the study found a higher percentage of branches went away in LMI areas (5.9%) versus MUI areas (5.4%).
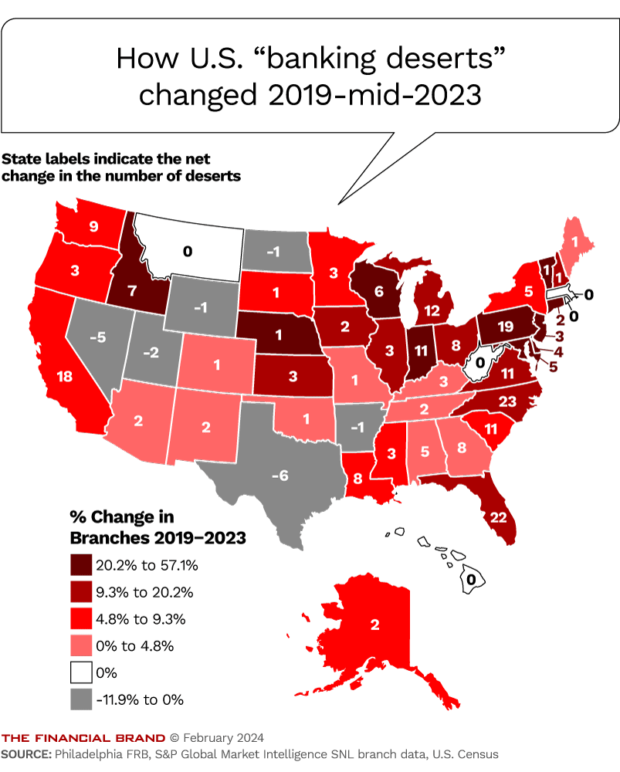
• Many states in the Mid-Atlantic states and New England saw the highest increases in banking deserts. Key among them: Delaware, Pennsylvania, New Jersey and Vermont.
• Six states in the South and West saw decreases in banking deserts. These included: Arkansas, Nevada, North Dakota, Texas, Utah and Wyoming.
Defining Banking Deserts Present, Potential and Past
Banking deserts rose by a net of 217 over the study period. At mid-year 2023 there were 3,618 banking deserts, up 6.4% from the 3,401 banking deserts that existed at the end of 2019. The report estimates that 12.3 million Americans live in banking deserts — 3.8% of the nation’s population.
The simple definition of a banking desert is a place where there is no physical banking service in the form of branches. In fact, there is no standard definition, according to the report. For purposes of the study, Philadelphia Fed staff framed three definitions of banking desert, each keyed to the type of market being examined. The key element is the presence or lack thereof of branches within a radius from the population center under analysis. The authors explain that the trio of distances account for the differing densities of the spaces in the markets:
• Urban markets: No bank branch in a radius of two miles. Urban banking deserts rose 7% over the study period.
• Suburban markets: No branch in a radius of five miles. Suburban banking deserts rose 6.3%.
• Rural markets: No branch in a radius of 10 miles. Rural banking deserts rose 6%.
Using these metrics, the researchers arrived at four classifications:
• areas that are not banking deserts;
• banking deserts;
• potential banking deserts, usually served by a single branch; and
• “partially cured” deserts where a former desert has seen at least one new branch open.
Here’s a breakdown of people living in banking deserts as of mid-2023, broken down by demographic groups:
By tract majority race/ethnicity:
American Indian/Alaska Native: 46.4%
Asian: 0.5%
Black: 2.8%
Hispanic: 2.8%
White: 4.3%
Diverse (no predominant race): 2.0%
By tract median family income:
Low- and moderate-income: 3.2%
Middle- and upper-income: 4.0%
By other categories:
Low device access: 5.4%%
Low broadband access: 6.1%
High share of older residents: 4.8%
High share of disabled residents: 5.8%
Read more:
- How to Downsize Branches Without Losing Prime Locations
- JPMorgan Chase Defends Contrarian Branch Strategy as Deposit-Gathering Machine
- Why Bank of America Is Covering the Country with Branches
Our Take
We suspect that to fully understand life in a banking desert, one would have to live in one. We live in a suburban market flush with bank and credit union branches nearby.
What we liked: The study puts some numbers on current branch trends, especially given the influence of branch closures among the nation’s largest banks, and the resulting shifts in areas at an industry level. A reprise of the research in a couple of years, as closures and extensions by JPMorgan Chase and others continue, would be fascinating.
What we didn’t like: Let’s put aside the vast number of routine banking transactions that can be handled with a smart phone or a laptop. An implication of the study is that some groups want to be able to transact in person, including being able to withdraw cash.
Some data covering owned ATM networks and shared ATM networks would have been illustrative. How many areas classified as banking deserts are served by ATMs?
The study does include a section on potential strategies for places where branches are closed. This includes use of interactive teller machines in unmanned branches to replace closed branches and use of mobile branches.
Things that made us go “Hmm”: In mulling over the findings, we also recalled how some providers, such as Green Dot, which has a bank charter, tap nonbank locations to serve routine transaction needs. Green Dot Network operates in cooperation with more than 90,000 U.S. retail locations that function as quasi-branches for Green Dot’s own customers as well as customers of third parties such as digital banks and digital wallet providers that have partnerships with the company. Chime, branchless and one of the leading fintechs, brags about its 60,000 fee-free ATMs in various retail stores.
What’s to stop banks and credit unions from setting up such arrangements in banking deserts?