 To understand social media trends in financial institutions, Unmetric, a brand-focused social media intelligence company, set out to study the strategies and approach of the top 30 banks in the U.S. As it turns out, seven didn’t even have an active social media presence. But for the remaining 23, Unmetric looked at their social media presence and analyzed 27.6 million user interactions across more than 300,000 pieces of brand content.
The analysis revealed some key trends. Banking providers are opting for quality over quantity. They are putting more care and thought into the type of content they create for social media, but the content they are creating generates more interactions.
Here are five stats and facts Unmetric uncovered in their study that you can use to hone your institution’s social media strategy.
1. Financial Institutions Are Publishing 44% Less Content
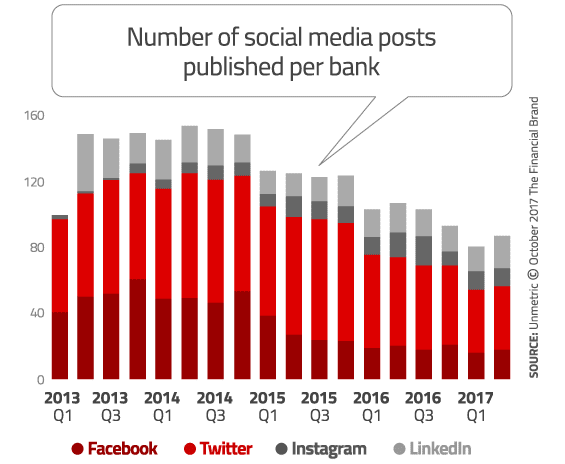
Since Q2 2014, the amount of social media content published by financial institutions has fallen by 44%. Facebook took the biggest hit: financial institutions that had been posting up to 60 Facebook posts a quarter now post only 18.
These are averages, and then there are exceptions. Some financial institutions continue to pump out a high volume content. BBVA Compass, for instance, publishes an average of 14 pieces of content per day, and Santander in the U.S. is publishing twice as much content as it did in 2013. (Santander US ranks #68 and BBVA Compass ranks #89 on The Financial Brand’s list of the top banks using social media.)
Financial institutions have seemingly come to the conclusion that just because they can post content on social media, it doesn’t mean they should.
Read More: 9 Ways Financial Institutions Can Leverage Social Media to Achieve Business Goals

Unlocking Digital Acquisition: A Bank’s Journey to Become Digital-First
This webinar will offer a comprehensive roadmap for digital marketing success, from building foundational capabilities and structures and forging strategic partnerships, to assembling the right team.
Read More about Unlocking Digital Acquisition: A Bank’s Journey to Become Digital-First

Send the Right Offers to the Right Consumers
Achieve a better return on your marketing investment. Leverage behavioral data and analytics to target the right customers with the best possible offers.
Read More about Send the Right Offers to the Right Consumers
“In the early days of social media, brands did the equivalent of people tweeting what they had for breakfast,” says Lakshmanan (Lux) Narayan, Unmetric’s co-founder and CEO. “Financial institutions and other industries thought of social media platforms as a soapbox to share everything and anything.”
Luckily, financial institutions have experienced “a moment of sanity” in which they are more judicious about what they post.
There are also other reasons that explain the significant drop in content, says Narayan. In addition to be more discerning with the content they push out, the type of content is changing. Rather than text-based posts, financial institutions are churning out video (see point #2 below). Because video is more time and resource-intensive than a simple text post, banks and credit unions are spending the same amount of time and money on social media content but can only post one video versus many texts.
This applies across industries as well.
“The quality of content is getting better across all brands in all sectors,” notes Narayan.
Another reason for the 44% drop in content has to do with an increase in the number of “dark posts” that don’t appear on financial institutions’ public Facebook timelines. Instead, dark posts are sent to targeted subsets of consumers.
“If financial institutions are tailoring messages to specific target segments, then we won’t pick up that post on their public wall,” explains Narayan.
Key Takeaway: Less is more. Publish fewer posts, but increase your investment in the content that you are creating.
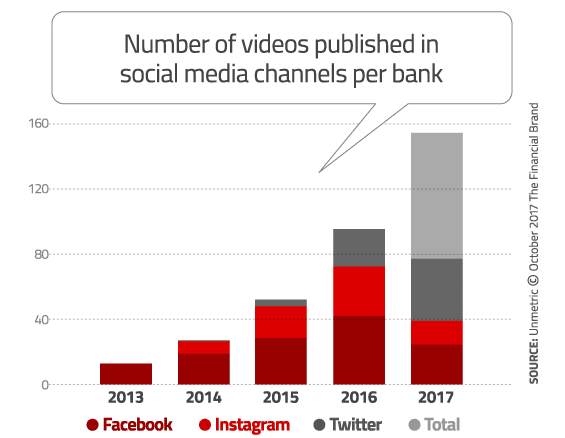
2. Video Content Is Up 632%
Video content is exploding, with a 631% increase in video content in 2017. Video still accounts for a small portion of overall social media content — only about 16% — but since video is twice as likely to be shared than any other content, expect video to continue its meteoric rise.
(Note: Unmetric only analyzed videos posted on Facebook, Twitter, and Instagram. Narayan notes that it’s likely that they will add YouTube to the list of platforms they study the next time.)
The average length of videos posted by financial institutions is around two minutes.
TD Bank and BMO Harris Bank are both big believers in video content, with each bank posting video in than half of its’ Facebook posts. Capital One generated the most interactions on its Twitter videos, and its animated GIFs generated almost four times the number of interactions.
TD Bank has generated 54 million total video views on YouTube, putting it at #2 on The Financial Brand’s rankings of North American institutions on YouTube — right behind Wells Fargo with 67 million all-time views.
Key Takeaway: If you haven’t already, get those cameras rolling.

3. Promoted Content Generates 21x More Interactions
Back in 2014, The Financial Brand predicted that opportunities for free marketing on Facebook would eventually disappear as the social media behemoth began moving to a pay-for-play model. Well, it happened. Organic reach on Facebook is officially dead.
Now the only way to get in front of a Facebook user is to pay for it. That explains why promoted content generates 21 times more interactions per post than non-promoted content.
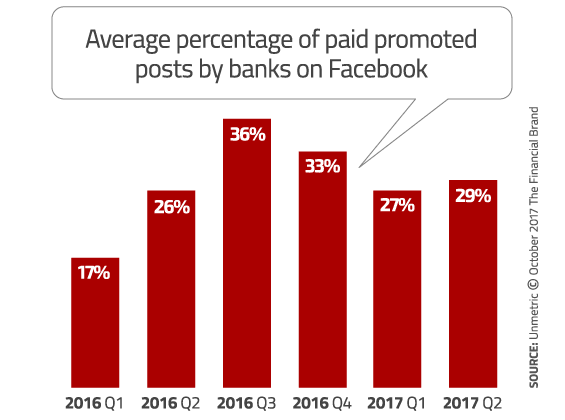
Many financial institutions, such as Fifth Third Bank which promoted 75% of its Facebook posts in the first half of the year, have come to accept that marketing on Facebook is no longer a free ride. Others continue to resist paying for promoted content. For example, Comerica Bank promoted less than 3% of its Facebook content.
At least for BB&T, Capital One, and Regions Bank, promoted content is paying off; 95% of the interactions those banks received were from promoted content.
At face-value, it would seem that promoted content is wildly more successful than organic content. But that depends on how much each promotion costs. According to Unmetric’s Narayan, it’s tricky to estimate costs since Facebook’s pricing varies based on the number of filters chosen. If a financial institution wants to limit posts to a particular geography or demographic, this more targeted post would cost more than a generic post, thereby increasing the cost per interaction.
Key Takeaway: Free content just isn’t getting the reach it once did. Be prepared to pay to play.
4. Only 4% of Your Customers Will Connect With You on Facebook
Some financial institutions get more than that. Capital One reaches a Facebook audience equal to 9.51% of its customer base. But they are the exception, not the rule. Most banking providers will be lucky to get more than 4.0% of their customers to like them on Facebook.
| Bank | Customers | Facebook Fans |
% of Customers |
|---|---|---|---|
| Capital One | 45,000,000 | 4,278,810 | 9.51% |
| Chase | 60,000,000 | 3,957,246 | 6.60% |
| Bank of America | 47,000,000 | 2,811,557 | 5.98% |
| Citi | 110,000,000 | 1,173,708 | 1.07% |
| USAA | 11,400,000 | 1,089,995 | 9.56% |
| Wells Fargo | 70,000,000 | 1,011,850 | 1.45% |
| PNC | 8,000,000 | 292,856 | 3.66% |
| US Bank | 18,000,000 | 276,117 | 1.53% |
| Regions | 8,900,000 | 260,650 | 2.93% |
| Fifth Third | 6,000,000 | 196,750 | 3.28% |
| KeyBank | 4,000,000 | 120,974 | 3.02% |
| SunTrust | 3,300,000 | 85,442 | 2.59% |
| Bank of the West | 2,200,000 | 44,390 | 2.02% |
| TOTAL | 393,800,000 | 15,600,345 | 3.96% |
Some of these numbers might look impressive, but if you project the relative percentage of fans onto more modest sized community banks and credit unions you would be looking at a Facebook fan base numbering just a few hundred — which is what most financial institutions have. Which should make the typical financial marketer wonder, “Is this really worth it??”
According to Unmetric, the biggest banks in the U.S. average around 650,000 fans on Facebook, which is more than three times their average audience on LinkedIn. But that doesn’t’ mean that LinkedIn doesn’t have a place, where they have an average of 187,000 followers.
Only one in three of the banks analyzed by Unmetric had a presence on Instagram, and the average Instagram audience size was a paltry 16,000 per institution. However, Instagram is also the platform with a growth rate of 27%, much faster than other social media platforms.
The winner in the number of Facebook interactions is Capital One, which got 317,904 interactions on 79 posts.
Of course, financial topics weigh heavily as content topics, but financial institutions are increasingly using social media to recruit employees. Here are the top four topics that financial institutions are talking about:
- Jobs & Careers
- Tips
- Promotions
- Retirement
Key Takeaway: Facebook continues to be important, but don’t neglect LinkedIn, Twitter, and especially Instagram.
5. You Have 15 Minutes To Respond To Social Media Complaints
Facebook may boast the biggest audience numbers, but Twitter remains an important platform for handling people’s requests and complaints. The financial institutions in the Unmetric study responded to 55% more tweets than they did in 2013.
And response times are getting better. In 2016, financial institutions responded to more than one third of tweets within 15 minutes. The fastest was TD Bank, which responded to an impressive 75% of tweets within 15 minutes.
But financial institutions are not just reacting to tweets, they are also using Twitter proactively. From January through June, Unmetric captured 5,200 tweets from the 23 financial institutions active on Twitter. In addition, about one-quarter of those proactive tweets were promoted tweets, says Narayan.
Key Takeaway: When people want to gripe about their bank or a bad service experience, they will do so in social channels — mostly Twitter and Facebook. And when they do, you can get your brand’s reputation back on the mend by responding in 15 minutes or less.


