If you’re like most every other bank or credit union in the financial industry, you’ll have less than 1,000 ‘Likes’ on Facebook. On Twitter, you’ll have fewer than 250 followers. But what if you’re a top performer — among the industry’s social media elite? How many ‘Likes’ might you have? Roughly one for every $500,000 your financial institution has in assets.
Using The Financial Brand’s Power 100 tool, a database of financial institutions with the most Facebook ‘Likes’ and Twitter followers, you can analyze the size of the social media communities built by banks and credit unions in the U.S. relative to their asset size.
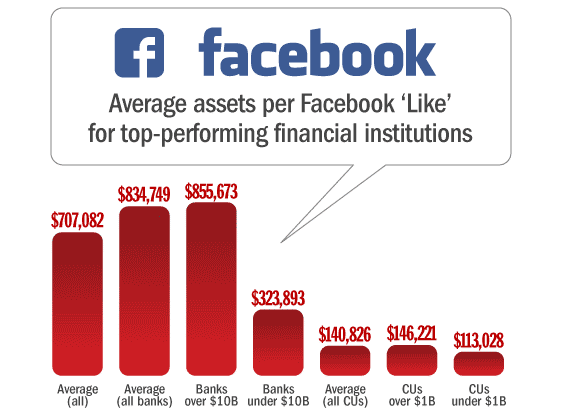
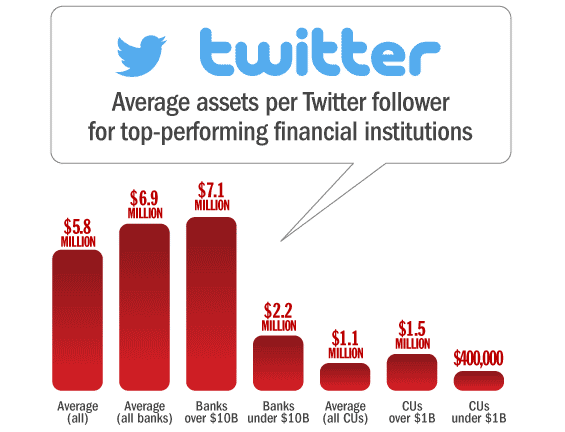
Among all financial institutions in the Power 100 database, the average is over $700,000 in assets for every one ‘Like’ on Facebook, and $5.8 million for every one follower on Twitter. Again, remember: these are stats for the top banks and credit unions using social media today.
Comparing banks vs. credit unions, it seems that not-for-profit financial cooperatives have an easier time building their social media communities. Among the top banks on Facebook, the average assets-per-Like works out to $834,749. But for credit unions, this number drops down to $140,826 — a factor of six.
Only one credit union in 112 generates more than one ‘Like’ for every $100,000 in assets they have, while only one bank in 1,000 generates more than one ‘Like’ for every $100,000 in assets they have. In other words, if you have 2,000 ‘Likes’ on Facebook and $200 million in assets, you are in rarified air — among the top 1.0% to 0.1% of financial institutions on earth.

Unlocking Digital Acquisition: A Bank’s Journey to Become Digital-First
This webinar will offer a comprehensive roadmap for digital marketing success, from building foundational capabilities and structures and forging strategic partnerships, to assembling the right team.
Read More about Unlocking Digital Acquisition: A Bank’s Journey to Become Digital-First

Navigating Credit Card Issuing in an Uncertain Economic Environment
Build a modern credit card strategy that balances profitability and risk, adopts the latest technology and delivers the customization that cardholders demand.
Read More about Navigating Credit Card Issuing in an Uncertain Economic Environment
Assets Per Like for the Top 10 US Banks on Facebook
| Bank | Assets | Facebook Likes | Assets Per Like |
|---|---|---|---|
| Capital One | $300 billion | 3,200,000 | $92,825 |
| Chase | $2 trillion | 2,700,000 | $741,499 |
| BofA | $2.1 trillion | 2,000,000 | $1,051,000 |
| Citi | $1.7 trillion | 1,100,000 | $1,521,242 |
| Wells Fargo | $1.5 trillion | 733,800 | $2,080,948 |
| USAA | $125 billion | 713,400 | $171,298 |
| TD | $220 billion | 529,100 | $415,153 |
| US Bank | $389 billion | 175,700 | $2,214,001 |
| PNC | $317 billion | 174,100 | $1,818,001 |
| Ally | $100 billion | 151,500 | $670,267 |
Assets Per Like for the Top 10 US Credit Unions on Facebook
| Credit Union | Assets | Facebook Likes | Assets Per Like |
|---|---|---|---|
| Navy | $63 billion | 1,100,000 | $56,823 |
| America First | $6.3 billion | 138,200 | $45,237 |
| Mountain America | $4.1 billion | 134,900 | $30,013 |
| The Golden 1 | $8.5 billion | 47,000 | $181,012 |
| Suncoast | $5.8 billion | 47,000 | $123,741 |
| San Diego County | $6.4 billion | 36,400 | $179,534 |
| OnPoint | $5.3 billion | 33,800 | $104,265 |
| Scott | $964 million | 33,100 | $29,114 |
| SchoolsFirst | $10.4 billion | 31,500 | $330,959 |
| Kinecta | $3.4 billion | 30,000 | $112,453 |

Assets Per Follower for the Top 10 US Banks on Twitter
| Bank | Assets | Twitter Followers | Assets Per Follower |
|---|---|---|---|
| Citi | $1.7 trillion | 347,000 | $4,822,381 |
| BofA | $2.1 trillion | 345,000 | $6,092,754 |
| Goldman Sachs | $110 billion | 213,000 | $514,235 |
| Wells Fargo | $1.5 trillion | 118,000 | $12,940,678 |
| Capital One | $300 billion | 101,000 | $2,940,990 |
| USAA | $125 billion | 72,700 | $1,680,935 |
| Chase | $2 trillion | 33,000 | $60,668,091 |
| TD | $220 billion | 28,000 | $7,844,909 |
| Fifth Third | $130 billiion | 24,800 | $5,249,447 |
| Associated | $26 billion | 22,800 | $1,119,479 |
Assets Per Follower for the Top 10 US Credit Unions on Twitter
| Credit Union | Assets | Twitter Followers | Assets Per Follower |
|---|---|---|---|
| Navy | $63 billion | 66,600 | $938,515 |
| Liberty Bay | $670 million | 9,715 | $68,947 |
| The Golden 1 | $8.5 billion | 7,944 | $1,070,940 |
| Mountain America | $4.1 billion | 6,831 | $592,708 |
| Generations | $514 million | 6,706 | $76,714 |
| Michigan State University | $2.7 billion | 6,007 | $441,716 |
| America First | $6.3 billion | 5,371 | $1,163,986 |
| San Diego County | $6.4 billion | 5,177 | $1,262,325 |
| OnPoint | $3.5 billion | 4,786 | $736,346 |
| NuVision | $1.3 billion | 4,707 | $277,459 |


