The FDIC has just released what is probably the most exhaustive analysis of under- and unbanked households ever undertaken. The 155-page National Survey of Unbanked and Underbanked Households breaks down the data by age, ethic group, geography — just about any way you can think to slice it.
The FDIC partnered with the U.S. Census Bureau to conduct this survey back in June 2011, collecting responses from nearly 45,000 households. Through this partnership with the U.S. Census, the FDIC study is able to correlate data with rich demographic and geographic information gathered in the Current Population Survey. The research reveals insights previously unavailable on unbanked and underbanked households, and parses data down at the national, state and metropolitan levels.
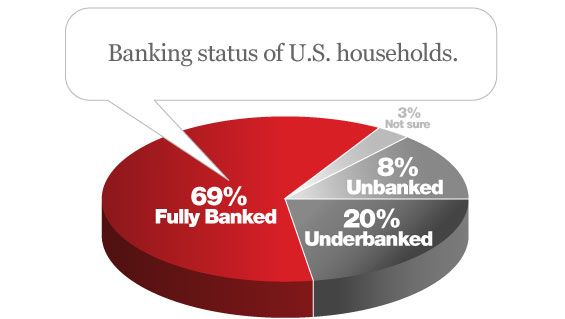
The FDIC used survey responses to categorize households’ banking status as “unbanked,” “underbanked” or “fully banked.” Unbanked households are those that lack any kind of deposit account at an insured depository institution. Underbanked households have a bank account, but also rely on alternative financial services (AFS) providers. Fully banked households are those that have a bank account of any kind and have not recently relied on any AFS.
More than one in four households (28.3%) are either unbanked or underbanked, conducting all or some of their financial transactions outside of the mainstream banking system.
| Banking Status | 2009 Households |
2009 % | 2011 Households |
2011 % |
|---|---|---|---|---|
| All U.S. households | 119.0 | 100% | 120.4 | 100% |
| Unbanked | 9.1 | 7.6% | 9.9 | 8.2% |
| Underbanked | 21.7 | 18.2% | 24.2 | 20.1% |
| Fully banked | 84.9 | 71.4% | 82.2 | 68.8% |

The unfair advantage for financial brands.
Offering aggressive financial marketing strategies custom-built for leaders looking to redefine industry norms and establish market dominance.

Industry Cloud for Banking from PwC
PwC’s Industry Cloud for Banking applies our deep industry knowledge to your specific business needs
| Demographic Group | % Unbanked | % Underbanked | % Fully Banked |
|---|---|---|---|
| All households | 8.2% | 20.1% | 68.8% |
| Blacks | 21.4% | 33.9% | 41.6% |
| Foreign-born citizens | 22.2% | 28.9% | 45.8% |
| Households experiencing unemployment |
22.5% | 28.0% | 47.5% |
| Lower-income households |
28.2% | 21.6% | 47.6% |
| Unmarried female family households |
19.1% | 29.5% | 48.4% |
| Hispanics | 20.1% | 28.6% | 48.7% |
| Households with those under age 24 |
17.4% | 31.0% | 49.7% |
This is the second such study the FDIC has commissioned. The first survey, also conducted on behalf of the FDIC by the U.S. Census Bureau, was conducted in 2009.
The FDIC says it hopes this study will address a gap in the availability of real, actionable data on unbanked and underbanked households.

Unlocking Digital Acquisition: A Bank’s Journey to Become Digital-First
This webinar will offer a comprehensive roadmap for digital marketing success, from building foundational capabilities and structures and forging strategic partnerships, to assembling the right team.
Read More about Unlocking Digital Acquisition: A Bank’s Journey to Become Digital-First

Instant Messaging. Instant Impact.
Connect with your customers and provide lightning-fast support as effortlessly as texting friends. Two-way SMS text messaging is no longer optional.
Unique Demographic Characteristics
Unbanked and underbanked households are not homogeneous populations. On the contrary, these groups have diverse demographic characteristics, past banking experiences, reasons for not holding an account, and future banking plans.
Comparing the demographic composition of unbanked, underbanked, and fully banked households shows stark differences between these groups. The same demographic groups are generally overrepresented among both unbanked and underbanked households. However, on many measures, such as employment and income, underbanked households are more similar to fully banked house- holds than to unbanked households.
The highest unbanked and underbanked rates are found among non-Asian minorities, lower-income households, younger households, and unemployed households. Close to half of all households in these groups are unbanked or underbanked compared to slightly more than one-quarter of all households. Relative to 2009, the estimated unbanked rates in 2011 are essentially unchanged for most groups.
1 in 12 Are Unbanked
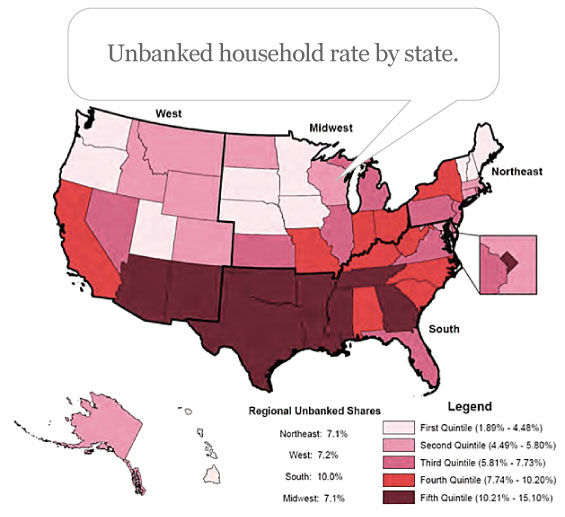
8.2% of U.S. households are unbanked. This represents 1 in 12 households in the nation, or nearly 10 million total. Approximately 17 million adults live in unbanked households.
The proportion of unbanked households increased slightly since the first FDIC survey. The estimated 0.6 percentage point increase represents an additional 821,000 unbanked households in the U.S.
Among unbanked households, slightly more than half have never had a bank account. Relatively high proportions of Hispanic (14.7%) and foreign-born non-citizen households (18.9%) have never had an account.
Certain segments of the unbanked population are more inclined to open an account. While most unbanked households report that they are not likely to open an account in the future, one-third (33.9%) report they are “very likely” or “somewhat likely” to do so. Unbanked individuals who are younger, unemployed, have some college education, and/or are in family households headed by an unmarried woman are more likely to open a bank account. Also, likelihood increases the more someone uses alternate financial services.
1 in 5 Are Underbanked
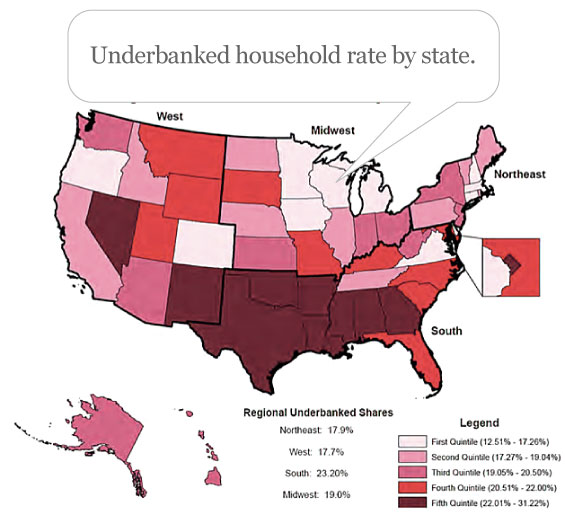
20.1% of US households are underbanked. This represents one in five households, or 24 million households with 51 million adults. The underbanked rate in 2011 is 1.9% higher than the 2009 rate of 18.2%.
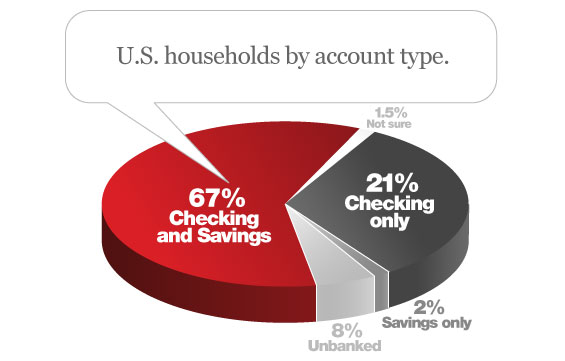
29.3% of households do not have a savings account, while about 10% do not have a checking account. About two-thirds of households have both checking and savings accounts.
One-quarter of households have used at least one alternative financial services (AFS) product in the last year, and almost one in ten households have used two or more types of AFS products. In all, 12% of households used AFS products in the last 30 days, including four in ten unbanked and underbanked households.

Banked Today, Unbanked Tomorrow
Having a bank account does not guarantee long-term participation in the banking system. Households can and do cycle in and out the banking system over time. For example, nearly half of unbanked households had an account in the past, and nearly half (48.2%) of these report that they are likely to join the banking system again in the future. Also, almost a quarter of fully banked households have used AFS in the past and could have been considered underbanked at that time.
Prepaid Grows in Popularity Among Unbanked
Prepaid debit cards continue to be more widely used among the unbanked and underbanked than among fully banked households. With one in ten households reporting use of a prepaid debit card, overall use of the product appears to be relatively stable from 2009. However, the proportion of unbanked households that have used a prepaid debit card climbed from 12.2% to 17.8% in 2011, with no significant change among the underbanked.
A Closer Look at the Hispanic Unbanked
Financial marketers targeting unbanked Hispanic households should note that this group includes two distinct segments with starkly different financial services behavior. One substantial segment (29.6 percent) of this group does not use any financial services from bank or non-bank provid- ers, while another uses AFS more actively than any other ethnic or racial group: 51.8 percent of unbanked Hispan- ics used AFS in the last 30 days, including almost a quar- ter (22.5 percent) who used two or more AFS in that period. In contrast, among other unbanked segments, only about 43 percent of white or black households used AFS in the last 30 days and about 14 percent used two or more in that time frame.

