Bancography, a branch and brand consulting company for financial institutions, has released a free report taking a close look at trends in deposit growth. Among the report’s conclusions? The “flight to safety” is over, making 2011 a much tougher year for growing deposits.
 In “Strategic Planning for 2011: Demographic and Competitive Outlook,” Bancography examines recent data in deposit growth for large and mid-sized U.S. markets. The report examines the latest FDIC, NCUA and demographic statistics, providing comparative data on deposit growth, income growth, branch concentration and other measures.
The report includes a number of tactical recommendations for marketing and branch planning in the year ahead.
Overall Deposit Growth Will Slow
The report Includes all deposits, including CDs. However, individual branch deposits are truncated at $250M to winnow out large deposits from corporate, brokered, public funds, and other non-retail sources. The data used was from June 30, 2010.

Navigating the Role of AI in Financial Institutions
83% of FI leaders agree investing in AI is essential for 2024 but how you leverage AI is instrumental in success and meeting customer expectations.
Read More about Navigating the Role of AI in Financial Institutions

Industry Cloud for Banking from PwC
PwC’s Industry Cloud for Banking applies our deep industry knowledge to your specific business needs
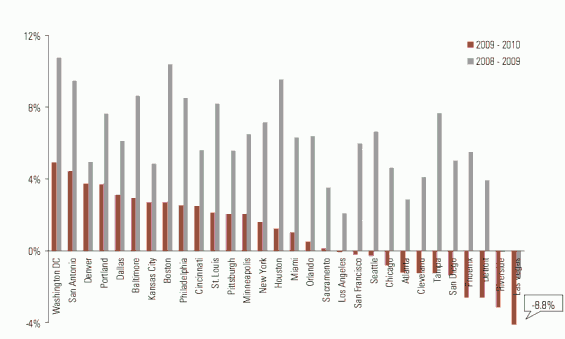
Two Year Deposit Change in Top 30 MSAs
Each of the top 30 markets grew at a slower pace in 2010 than inthe prior year. The top markets include a mix of geographies, though Northeast metros captured four of the top 10 spots. Markets troubled by structural economic erosion (Cleveland, Detroit) and markets at the center of the real estate implosion (Las Vegas, Riverside, Atlanta) lost deposits.
Deposit Growth Affected by Unemployment, Income, Weak Housing
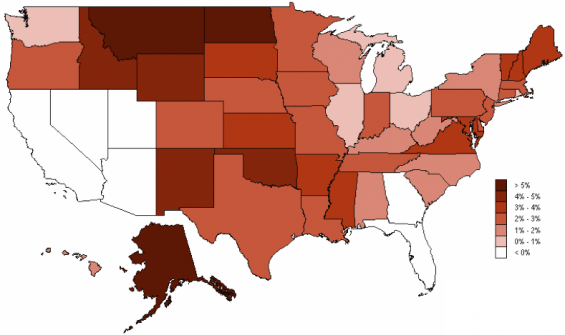
Five of the six states where deposits declined in 2010 ranked among the most in terms of unemployment, with Florida, Georgia, California and Nevada faring especially poorly. Conversely, economically healthier regions including the Dakotas and adjoining western states, northern New England and greater Washington DC showed both low unemployment and high deposit growth.
Though high unemployment clearly diminishes deposit growth by reducing aggregate income, there is a reciprocal aspect to the relationship, too; as the constriction of credit (which can be reflected in the deliberate run-off of deposits) can negatively impact employment rates.
Three of the states that lost deposits and that rank in the top unemployment tier –California, Florida and Georgia — rank among the top four in terms of recent FDIC bank seizures. Illinois, which ranks second in terms of FDIC closures, showed a deposit gain of less than 1% and also falls into the second highest unemployment tier.
Smaller Institutions Do Better, But Big Banks Get More
Smaller institutions have benefited from negative news surrounding mega banks. Credit unions and community banks outgrew all of the larger institution tiers, but on average still operate smaller branches than the largest banks.
| Deposit Growth 2009-2010 |
Deposits Per Branch (in millions) |
|
|---|---|---|
| Credit unions | 5.6% | $20.2 |
| Community banks | 4.6% | $40.1 |
| Super-community | 2.0% | $41.5 |
| Regional | 1.6% | $45.8 |
| Super-regional | 1.0% | $50.2 |
| National | 1.2% | $70.5 |
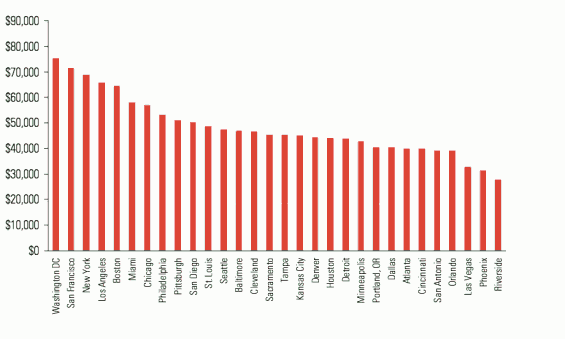
Deposits Per Household
Income translates directly into deposits. Affluent, high-income areas like those in California and the Northeast have the highest deposits per household. Most of the newer, less-established markets in the Sunbelt and West rank lower in terms of deposits per household.

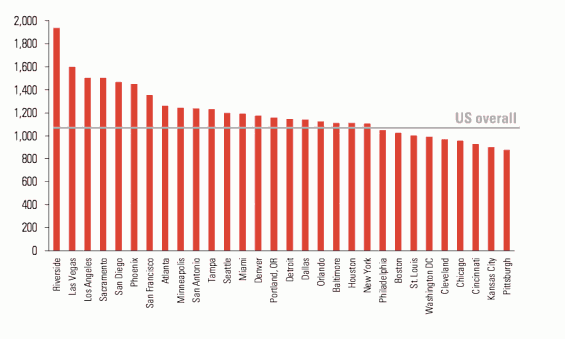
Branch Concentration
Established markets in the Northeast and Midwest have a higher density of branches, with one for every 900 to 1,000 households. California and other Western metros remain less concentrated. Riverside, San Bernardino, Las Vegas, Los Angeles and Sacramento contain only one branch for every 1,500+ households.
Deposits Per Branch
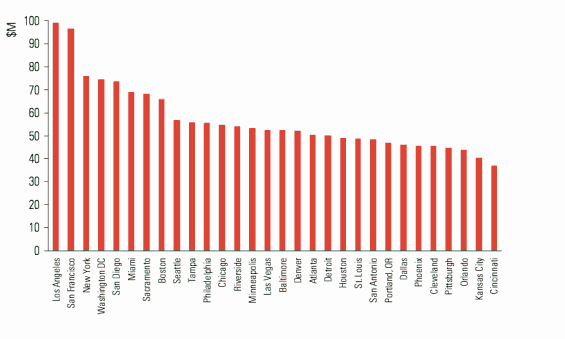
Intuitively, deposits per branch are highest in (1) high income, affluent metros, such as San Francisco, Boston and Washington, and (2) markets where there is a low concentration of branches, such as Los Angeles and Sacramento.
Bottom Line
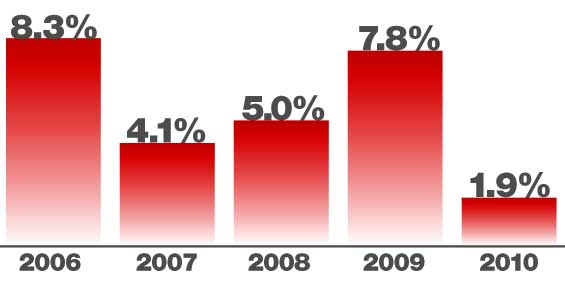
After a ‘flight to quality’ lift in 2009, deposit growth abated in 2010. The exodus of funds from the stock market in was a one-time rather than a recurring event. With stagnant employment constraining disposable income and a reviving stock market recapturing some bank funds, deposit gains will be difficult to achieve in 2011, and even then will require aggressive marketing and/or price-based offers.

