1. Email Penetration Rates for Banks & Credit Unions
Financial institutions collectively plateaued at 37% email penetration after Q2 2013. While credit unions collect a larger percentage of account holder email addresses than their bank counterparts, Harland Clarke Digital says there is still a lot of opportunity though for both banks and credit unions, and recommends that financial marketers actively look to collect email addresses at common points of interaction. Broadening awareness of email programs and clearly stating benefits are key components of a permission-based list-building strategy, the company adds.
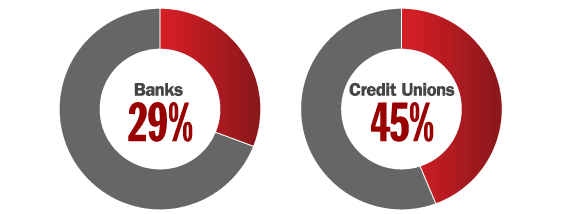
Source: Harland Clarke Digital 2014 Financial Email Marketing Benchmark Report
2. Average Number of Monthly Email Campaigns Sent by Banks & Credit Unions
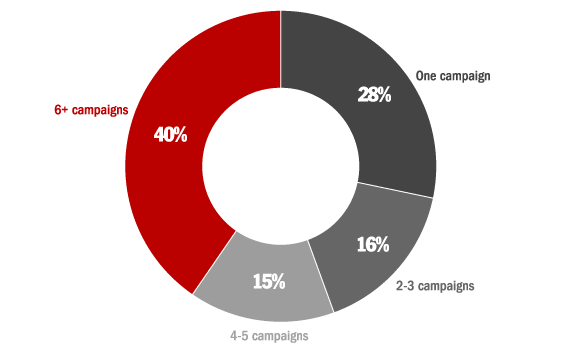
Source: Harland Clarke Digital 2014 Financial Email Marketing Benchmark Report
( Read More: 5 Major Email Marketing Trends in Banking )
3. Open Rates
| Unique Open Rates by Industry | Mean | Median | Top Quartile |
Bottom Quartile |
|---|---|---|---|---|
| Nonprofits | 25.3% | 23.1% | 44.9% | 9.1% |
| Computer Hardware, Telecom & Electronics | 23.1% | 19.7% | 41.7% | 10.1% |
| Computer Software | 22.1% | 19.4% | 40.7% | 8.4% |
| Consumer Products | 21.4% | 17.7% | 42.2% | 7.2% |
| Consumer Services | 25.5% | 20.9% | 49.8% | 9.1% |
| Education | 25.7% | 22.7% | 50.4% | 6.2% |
| Financial Services/Banks/Insurance | 22.4% | 19.5% | 42.8% | 7.0% |
| Healthcare | 26.2% | 23.4% | 46.8% | 10.5% |
| Travel & Leisure | 15.0% | 11.1% | 33.7% | 3.3% |
| Media & Publishing | 16.6% | 14.0% | 31.3% | 6.2% |
| Real Estate & Construction | 23.1% | 21.4% | 37.3% | 12.1% |
| Retail | 20.9% | 17.9% | 37.6% | 9.6% |
| Corporate Services | 20.7% | 17.9% | 41.2% | 4.9% |
| Industrial Manufacturing & Services | 22.2% | 19.7% | 38.1% | 11.0% |
Source: 2014 Silverpop Email Marketing Metrics Benchmark Study
4. Open Rates for Emails From Banks & Credit Unions By Device
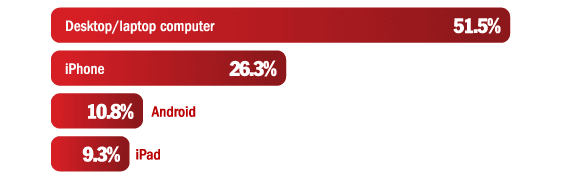
Source: Harland Clarke Digital 2014 Financial Email Marketing Benchmark Report
5. Click-Through Rates
| Unique Click-Through Rate by Industry |
Mean | Median | Top Quartile |
Bottom Quartile |
|---|---|---|---|---|
| Nonprofits | 4.2% | 2.3% | 11.5% | 0.4% |
| Computer Hardware, Telecom & Electronics | 3.6% | 1.6% | 10.6% | 0.2% |
| Computer Software | 2.9% | 1.1% | 8.8% | 0.2% |
| Consumer Products | 2.7% | 0.9% | 8.6% | 0.2% |
| Consumer Services | 4.7% | 2.3% | 13.2% | 0.4% |
| Education | 4.5% | 1.9% | 13.2% | 0.3% |
| Financial Services | 3.3% | 1.3% | 10.0% | 0.1% |
| Healthcare | 4.8% | 2.6% | 13.0% | 0.5% |
| Travel & Leisure | 2.2% | 0.8% | 6.8% | 0.1% |
| Media & Publishing | 2.6% | 1.1% | 7.8% | 0.2% |
| Real Estate & Construction | 3.9% | 2.8% | 8.8% | 0.9% |
| Retail | 3.4% | 2.1% | 9.1% | 0.3% |
| Corporate Services | 3.4% | 1.4% | 10.3% | 0.1% |
| Industrial Manufacturing & Services | 3.2% | 1.8% | 8.7% | 0.3% |
Source: 2014 Silverpop Email Marketing Metrics Benchmark Study
6. Email Marketing Metrics in Banking Based on Message Type
| Email Marketing Metrics in Banking Based on Message Type |
Open Rate |
Click Through Rate |
Click to Open Rate |
% of Total Emails Delivered |
|---|---|---|---|---|
| Acquisition | 11.0% | 0.7% | 6.0% | 0.8% |
| Marketing | 46.8% | 4.6% | 9.8% | 40.1% |
| Research | 50.0% | 7.1% | 14.1% | 0.0% |
| Service | 63.4% | 8.2% | 12.9% | 27.7% |
| Other | 55.8% | 5.4% | 9.6% | 31.5% |
Source: Epsilon Q4 2013 Email Trends & Benchmarks
7. List Segmentation
An email database is not one homogenous group. The team at Epsilon encourages financial institutions to segment their email contact lists. At the most basic level, Epsilon recommends dividing your list into two groups: mature subscribers and new subscribers. New addresses are those that have been on your list for less than three months. Mature addresses are those that have been in your database for over three months.
The Mature segment is broken into three categories:
- Superstars – Subscribers who have opened and/or clicked within the most recent three months
- Nappers – Subscribers who have opened and/or clicked emails more than three months ago
- Dormants – Subscribers who have been inactive for the past 12 months
The New segment is broken into two categories:
- Rising Stars – Subscribers who have both opened and/or clicked on an email
- Question Marks – Subscribers who have been inactive for the previous three months
| Level of Email Engagement by Industry |
Mature Superstar |
Mature Napper |
Mature Dormant |
New Rising Star |
New Question |
|---|---|---|---|---|---|
| Retail Apparel | 25% | 26% | 27% | 15% | 6% |
| Retail General | 23% | 47% | 16% | 7% | 8% |
| Banks & Credit Card Companies | 21% | 29% | 22% | 14% | 14% |
| Travel/Hospitality | 20% | 43% | 27% | 5% | 4% |
| Business Publishing/Media | 20% | 20% | 57% | 1% | 2% |
| Retail Specialty | 20% | 28% | 43% | 3% | 6% |
| Financial Services | 19% | 33% | 40% | 3% | 5% |
| Consumer Publishing/Media | 16% | 18% | 59% | 2% | 5% |
| Telecom | 15% | 23% | 59% | 1% | 3% |
| Consumer Services | 14% | 23% | 53% | 5% | 5% |
| Consumer Products | 12% | 46% | 34% | 3% | 5% |
| Business Products/Services | 11% | 35% | 45% | 3% | 6% |
| Pharmaceutical | 8% | 21% | 54% | 4% | 13% |
Rising Stars, Superstars and Nappers are considered active segments. Question Marks and Dormants are considered inactive segments.
Source: Epsilon Q4 2013 Email Trends & Benchmarks
8. Unsubscribe Rates
| Unsubscribe Rates | Mean | Median | Bottom Quartile |
|---|---|---|---|
| Nonprofits | 0.1579% | 0.0600% | 0.4968% |
| Computer Hardware, Telecom & Electronics | 0.1264% | 0.0000% | 0.4776% |
| Computer Software | 0.1901% | 0.0389% | 0.6381% |
| Consumer Products | 0.1627% | 0.0521% | 0.5358% |
| Consumer Services | 0.1260% | 0.0119% | 0.4481% |
| Education | 0.1966% | 0.0733% | 0.6019% |
| Financial Services | 0.1574% | 0.0131% | 0.5529% |
| Healthcare | 0.1015% | 0.0000% | 0.3765% |
| Travel & Leisure | 0.1680% | 0.0521% | 0.5498% |
| Media & Publishing | 0.0839% | 0.0113% | 0.3028% |
| Real Estate & Construction | 0.2040% | 0.0122% | 0.7452% |
| Retail | 0.1411% | 0.0842% | 0.3866% |
| Corporate Services | 0.2052% | 0.0554% | 0.6672% |
| Industrial Manufacturing & Services | 0.1751% | 0.0000% | 0.6273% |
Source: 2014 Silverpop Email Marketing Metrics Benchmark Study
9. Type of Emails Consumers Prefer
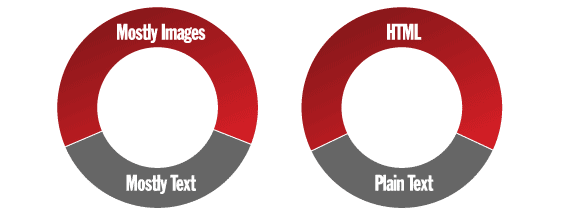
Source: HubSpot / Litmus
10. Effect of Number of Images on Email Click-Through Rates
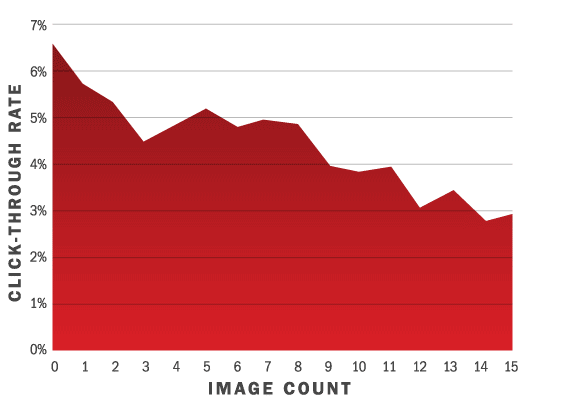
Source: HubSpot / Litmus
11. How Much of Their Email Consumers Actually Read
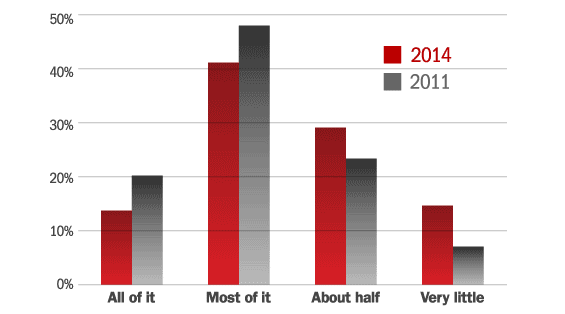
Source: HubSpot / Litmus
12. How Often Consumers Buy Products & Services From Email Marketing Messages They Receive
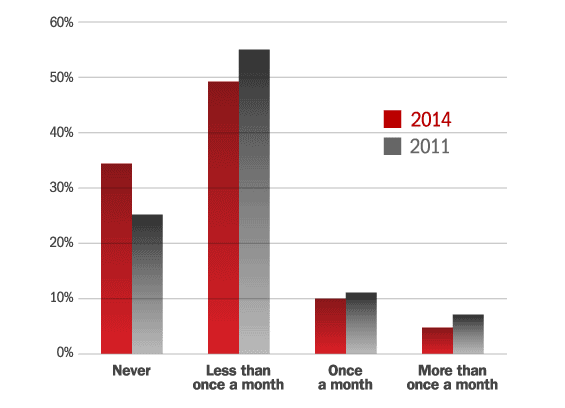
Source: HubSpot / Litmus