Google is the largest advertising platform in the world, and it is a juggernaut in search especially.
Roughly 89% of all U.S. Internet searches were done on Google in the first two months of 2023, StatCounter reports. This search activity is one of the main ways the company amasses the consumer data that makes its platform so attractive to advertisers.
Google is expected to account for more than half of all search ad spending in the United States through 2024, according to eMarketer.
The next biggest player, Amazon, has been steadily growing its search revenue for years, but its 22.6% share of the U.S. market in 2022 is less than half that of Google, eMarketer says.
We combed through research reports and scoured the Internet for all the latest and most helpful data we could find about advertising on Google.
The stats we assembled below are meant to help marketers at banks, credit unions and other financial services companies with evaluating their options.
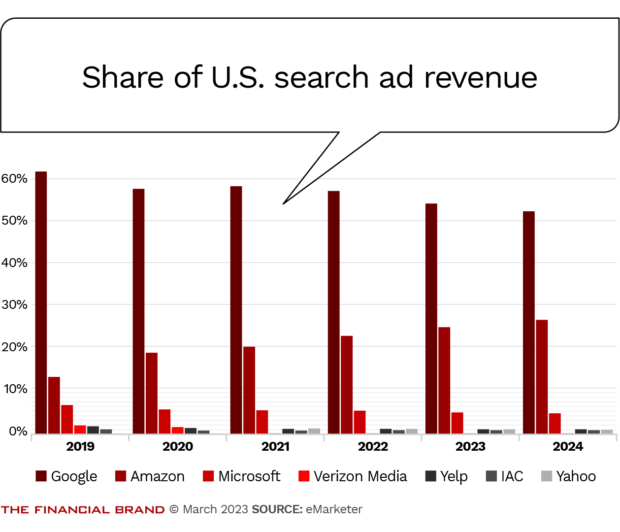
Note: The data for 2023 and 2024 is eMarketer’s forecast.
Google’s Global and U.S. Traffic
Google has more traffic than any other site in the United States or in the world. It had 80.2 billion visits in January 2023, 88.3 billion in December 2022, and 86.4 billion in November 2022.1
Google claims 93% of the search engine market share globally, as of February 2023. Its share is 88.99% in the United States.2
Google picked up 3.41 pageviews per visit on average in February 2023, and had a reported bounce rate of 42.48%. 3
Insight from eMarketer:
“In terms of its share of search queries, Google has nowhere to go but down. There are a few key players visible in its rearview mirror. Privacy-oriented search engines like Brave, DuckDuckGo, and ad-free Neeva are gaining ground among privacy-conscious consumers, but their user bases are minuscule compared with Google’s. If Apple is developing its own search engine, as rumors have suggested for years, Google Search will likely lose more traffic to Apple than most other competitors.” 4
The Cost and Performance of Banking Ads
The average click-through rate, or CTR, of Google ads for finance and insurance companies was 8.88% in 2022. This is the fourth-best industry CTR, following arts and entertainment (16.29%), sports and recreation (11.69%), and travel (10.29%). (The “finance and insurance” category, as defined by LocalIQ, includes banks, credit card companies, credit unions, insurance companies and more.) 5
The average cost per click across all Google ads was $2.96 in 2022. But the average for companies in the finance and insurance category worked out to $3.41 per click. 5
The average cost per lead, or CPL, for Google ads was $40.74 in 2022. The cost went up for most sectors. However, for finance and insurance companies, the CPL rate went down 2% compared with the previous year, to $61.38, a rate that is still significantly higher than the overall average. 5
Read More:
- 4 Ways Banks Can Use Google Alerts & Social Monitoring to Drive Growth
- Why Calculators Are Essential to a Bank’s SEO Strategy
Key Stats on Google Search Results
The top three Google search results get 54.4% of all clicks. 6
Search results in the first slot on Google had an average click-through rate of 28.23% in February 2023. The second position had a rate of 14.97%, and the third position, 8.83%. By the time you get to the 10th position (which is the last result on the first page of the default Google search page), the CTR falls to 0.99%. 7
Less than 1 percent of people (0.63%) will click on a result on the second page. 6
Google searches that indicated a question (including “who,” “what,” “why,” “how” or ended with a question mark) had a slightly higher average click-through rate — 16.3% vs. 15.5%. 6
Mobile vs. Desktop Google Stats
Mobile devices are where 84.2% of Google visits originated in February 2023. Mobile accounted for 81.7 billion visits over the course of the month, whereas 15.3 billion visits originated from a desktop device. 3
The number of pages per visit is higher among people using Google on their desktop computer (4.5) than on a mobile phone (3.2). This data point, from February 2023, was consistent with the previous six months. 3
People using Google also spend more time on page on their desktop computers (28 minutes, 23 seconds) than they do on mobile (19 minutes, 51 seconds). This data, also from February 2023, was consistent with the previous six months. 3
Google Keyword Insights
Here’s the average cost-per-click for ads tied to the following banking-related keywords, as of March 2023, according to SEMrush:
- Bank/banking — $10.36
- Credit union — $2.72
- Credit card — $9.44
- Bank account — $13.74
- Checking account — $13.13
- Savings account — $9.36
- Bank CD — $2.14
- Business banking — $13.87
There are 31,000 keywords with search volumes of more than 100k searches per month, and there are 3.8 billion keywords that have fewer than 10 searches per month. 8
There was a 30% year-over-year increase from 2021 to 2022 in search interest in “time to” search results, such as “Is now a good time to buy a house?” 9
See all of our most recent articles about bank marketing.
Demographics of Google Users
The United States accounts for the largest share of Google traffic, at 16%. India ranks second, at 11%. No other country is above a 5% share. 3
Demographically, the highest segment of Google’s visitors are consumers ages 25 to 34 (30.12%), followed by those 18 to 24 (24.20%), 35 to 44 (18.96%), 45 to 54 (12.64%), 55 to 64 (8.63%) and 65 and older (5.45%). 1
The Mysterious Algorithm Behind Search Results
While Google is estimated to make changes to its search result algorithm(s) thousands of times every year, it only released two core updates in 2022 and three in 2021, according to Search Engine Land. These core updates can drastically alter SEO marketing and search engine ad buys. 10
Google also periodically updates how it assesses “helpful content,” and a major update of this type began in early December 2022 and wrapped up January 12, 2023. This affects whether and at what rank content from a specific website appears in search results. Here’s our overview of what the changes mean for bankers.
Other Data About Google Advertising
Google says it assumes that “businesses make an average of $2 in revenue for every $1 they spend on Google ads” and that “businesses receive an average of five clicks on their search results for every one click on their ads.” Google claims that both of these assumptions are based on estimates using 2009 data. 9
Google made $162,450 billion in advertising revenue on “Google Search & Other” in 2022, which made up 57.4% of its total revenue for the year. Google advertising reported revenue of $224,473 billion in 2022 (which also includes revenue from Google Network and YouTube ads). Google reports that more than 80% of its total revenue originated from online advertising in 2022. 11
Several state Attorneys General have filed antitrust complaints in the U.S. District Court for the Eastern District of Texas against Google’s advertising technology and digital advertising technology products, arguing that they violate U.S. antitrust laws. 12
Sources: 1 Similar Web, 2 StatCounter, 3 SEMRush, 4 eMarketer, 5 Wordstream, 6 BackLinkO, 7 Advanced Web Ranking, 8 Ahrefs, 9 Google, 10 CMSWire, 11 Alphabet SEC Filing 12