1. Heatmaps
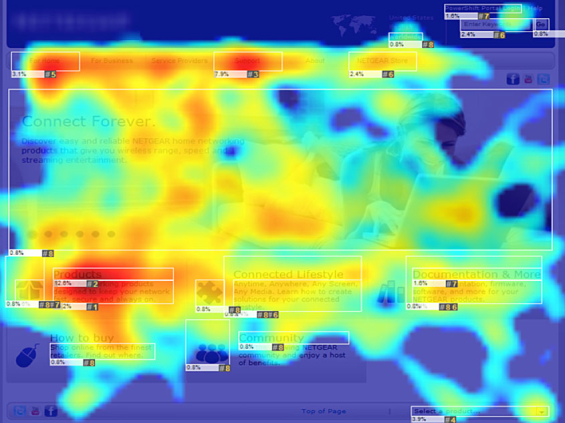
What it is: Mouse tracking organizations such as ClickTale, CrazyEgg, and TeaLeaf provide heatmaps demonstrating where visitors move their mouse on a page, where they hover/hesitate, and for how long the user mouses around in aggregate across multiple user sessions. These reports are often segmented similarly to those in your web analytics suite. The mouse movement reports can also be compared with actual clicks on links. Heatmaps are also a great way to visualize how visitors swipe and pinch with their fingers on devices with touch screens (i.e., tablets), sometimes highlighting content that may be too small for users to see without magnification.
Why it is useful: Mouse hesitation on links can give us hints on what navigation text is clear to users and what words/phrases might be unclear to users. Mouse movement and clicks on non-clickable areas of the page can either show visitor interests (i.e., product images) or confusion. On pages that are not dominated by article-like text, there is a very high correlation between eye movement and mouse movement, showing you where visitors look on a page. Extractable it highly useful to get graphic designers and UX team members into a room to review heatmaps collaboratively. Often different roles interpret the mouse movements and pauses in different ways.

Why Industry Cloud for Banking?
PwC’s Industry Cloud for Banking helps deliver personalized products and services that today’s customers expect.

The unfair advantage for financial brands.
Offering aggressive financial marketing strategies custom-built for leaders looking to redefine industry norms and establish market dominance.
2. Top 5 Click Paths by Segment
What it is: Click path reports can be difficult to understand at first, but when you start comparing and contrasting different paths, they become amazing treasure troves of information. Click path reports vary significantly from one provider to the other, but they essentially show the progression of content views and tool usage in a single visit from the point of entry (i.e., Google) to the site exit (i.e., log out or back to Google). These reports can be filtered by visit attributes such as the depth of the visit, the duration of the visit, or the count of the visit (i.e., 4th visit).
Why it is useful: Click paths can show points of weakness in content hierarchies and demonstrate how strong the site is at acquiring traffic from multiple sources. Like most other reports, click paths become much more valuable and actionable when viewed through segments. For complex products such as mortgages and home refinancing, we find that the progression of content consumption can help predict conversion rates. It’s important to segment these reports by the count of visits for the users because people often change their navigation patterns as they better learn the site over a series of visits.
3. Non-branded SEO
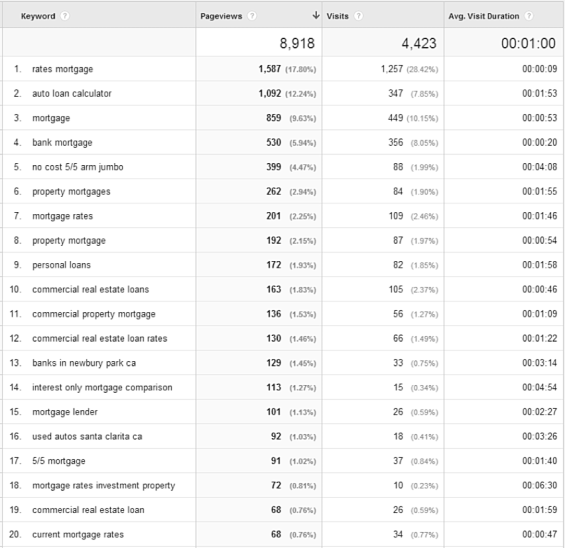
What it is: The following report shows the traffic that a site is getting from search phrases that do not contain iterations of the company name or tagline, product names, or other trademarked assets. On sites with strong content, linking strategies, and social strategies we see this traffic accounting for 10%-40% of the traffic. It’s important in these reports to show data that estimates a value for each phrase (or groups of phrases) such as cost per impression, conversion assists, or conversions.
Why it is useful: When categorizing the key phrases into groups, we can see how well the site’s content matches up with the organizational goals. For example, if a banking site’s major non-branded SEO traffic comes from regional branch and online banking phrases (i.e., “Austin drive through tellers”) but the organization is projecting that the majority of their growth will come from personal loan products, then we can see where the opportunity lies for increased traffic through targeted content. For financial institutions, search engines are typically the best opportunity for both large growth and profitable growth in acquiring and converting new customers. The non-branded SEO report is excellent at showing where the organization can focus SEO and copywriting efforts to capitalize on that growth.

4. Site Speed Reports
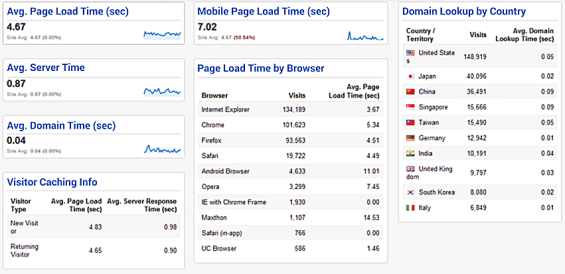
What it is: Speed reports show all sorts of data points. These reports can provide data on everything from page load times to the latency affects from concurrency, server response times, domain lookup times, points of bottle necking, and how geography affects downloads.
Why it is useful: Most organizations don’t have a quantifiable understanding of how load times affect important behaviors such as engagement, traffic acquisition, search engine results, and conversion. Speed reports not only help us understand why load time optimization is important, but how important it is. These reports help us understand which elements are having a negative impact on site performance and how to fix the problem.

