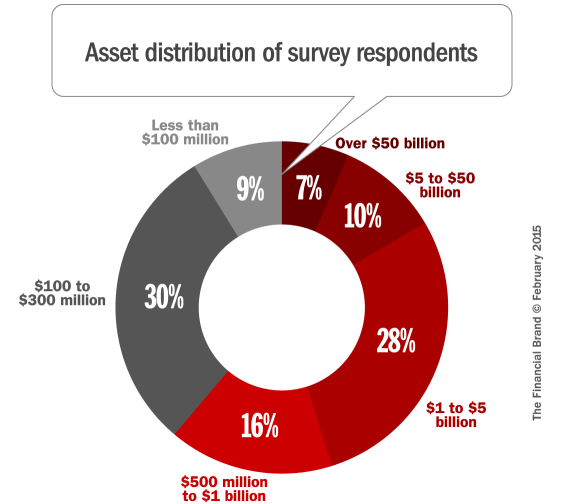
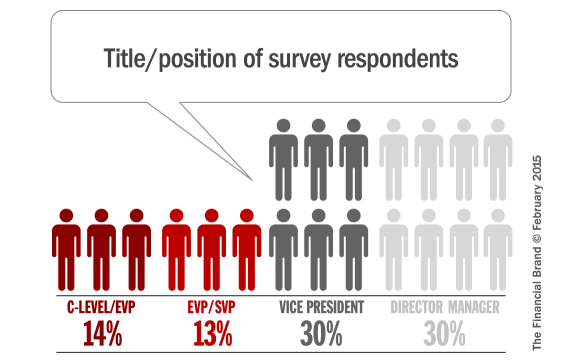
2015 marks the fifth year The Financial Brand has fielded its annual “State of Marketing in Retail Banking” study. Roughly 439 financial institutions from around the world participated in the survey this year — 44% banks and 52% credit unions. The full survey analyzes over 30 different parameters, segmenting respondents along a multitude of performance and results metrics. The report breaks down all the trends — who’s doing what, spending more, in which channels and generating results. (Please note: the results you see below are only a small sample of what the report covers.)

The unfair advantage for financial brands.
Offering aggressive financial marketing strategies custom-built for leaders looking to redefine industry norms and establish market dominance.

The Financial Brand Forum Kicks Off May 20th
Explore the big ideas, new innovations and latest trends reshaping banking at The Financial Brand Forum. Will you be there? Don't get left behind.
Read More about The Financial Brand Forum Kicks Off May 20th
How Financial Institutions Allocate Their Marketing Budgets
The bulk of banks and credit unions allocate between 30% and 50% of their marketing budgets to acquiring new customers/members. Another 20% to 40% is devoted to onboarding, upselling and cross-selling, while the balance (10% to 30%) goes toward other initiatives.
42% of financial institutions say they spend between 30% and 50% of their budget in broadcast and offline media channels (e.g., TV, print, radio). 8% say they don’t spend anything in offline media anymore. Half of all survey respondents say they have no intention to make any changes to their broadcast media budget in 2015, while 17.3% say they will increase their investment slightly and 7.3% will increase their TV/radio budget by as much as 20%.
While most financial marketers say they intend to cut back on print advertising, investments in direct mail and database marketing are expected to increase significantly. Only 15.1% of banks and credit unions say they will reduce efforts in this area, while 46.9% say they will be increasing their budgets up to 20% or more.
The typical bank or credit union plans to put about 20% to 30% of their marketing budget towards online media, including web advertising, social media and SEM. Meanwhile, financial marketers are making modest investments in the mobile channel, with slightly more than half saying they will allocate between 10% and 20% of their budget in this area in 2015. Online advertising, search engine marketing and email marketing are the top three digital marketing channels seeing the sharpest budgetary increases in 2015.
Most Important Products & Services
The top three product marketing priorities for financial institutions have remained the same since the last study, but their relative importance has shifted. Banks and credit union say they are less intent on marketing mobile banking solutions this year vs. last year, which is surprising.
Reality Check: Marketing mobile banking solutions will remain a top-three priority for financial institutions for the indefinite future. You will constantly need to be increasing awareness and adoption rates, while touting the endless stream of upgrades and new features you’ll be rolling out to stay competitive.
Financial marketers are less interested in pursuing business lending and business banking relationships. Where are they redirecting their energy? Auto loans and credit cards are receiving significantly more attention, and more financial marketers are shifting their focus from free to fee-based checking accounts.
| Products your financial institution will concentrate marketing on most heavily in the next 12 months |
— 2015 — | — 2014 — | Change |
|---|---|---|---|
| 1. Mortgage loans/refinancing | 65.1% | 67.3% | -2.2% |
| 2. Mobile banking solutions | 62.2% | 68.5% | -6.3% |
| 3. Auto loans/refinancing | 57.3% | 50.0% | 7.3% |
| 4. Credit cards | 52.3% | 43.5% | 8.8% |
| 5. Home equity loans/lines | 51.5% | 50.8% | 0.7% |
| 6. Online banking/bill pay | 41.9% | 48.5% | -6.6% |
| 7. Business lending | 40.7% | 46.9% | -6.2% |
| 8. Free checking accounts | 38.6% | 50.8% | -12.2% |
| 9. Business banking services | 32.8% | 44.2% | -11.4% |
| 10. Financial education | 25.7% | 25.8% | -0.1% |
| 11. Checking accounts (fee-based) | 23.7% | 20.4% | 3.3% |
| 12. Interest checking accounts | 17.8% | 16.5% | 1.3% |
| 13. Youth/kids accounts | 13.7% | 14.6% | -0.9% |
| 14. Certificates/term deposits | 12.9% | 14.2% | -1.3% |
| 15. Savings accounts | 12.9% | 14.6% | -1.7% |
| 16. Retirement products | 11.2% | 16.9% | -5.7% |

Social Media Not Getting The Job Done
When asked about the efficacy of various social media channels, most financial institutions are underwhelmed or — at best — neutral/indifferent.
Most banks and credit unions say they are using social media primarily for “customer/member engagement.” While 86.5% say “engagement” is the main reason why they were on Facebook, only 20.0% felt it was very effective at accomplishing their goal — almost equal to the number who said it was not effective at all. Two thirds of financial institutions said “meh,” Facebook was only somewhat effective for them.
A whopping 93.5% of banks and credit unions say Twitter is either not productive or only marginally productive, with roughly one third of institutions saying Twitter isn’t getting the job done at all.
One in six financial institutions say they are using LinkedIn to acquire new customers/members — 10% of those say they are very successful with their efforts, but four times as many say LinkedIn isn’t working for them.
Google+ and Pinterest are two social media channels that clearly aren’t panning out. Only 5.3% of financial institutions using Google+ feel it is effective. Even fewer — 3.0% — think their use of Pinterest is worthwhile.
Few Financial Institutions Closing Branches
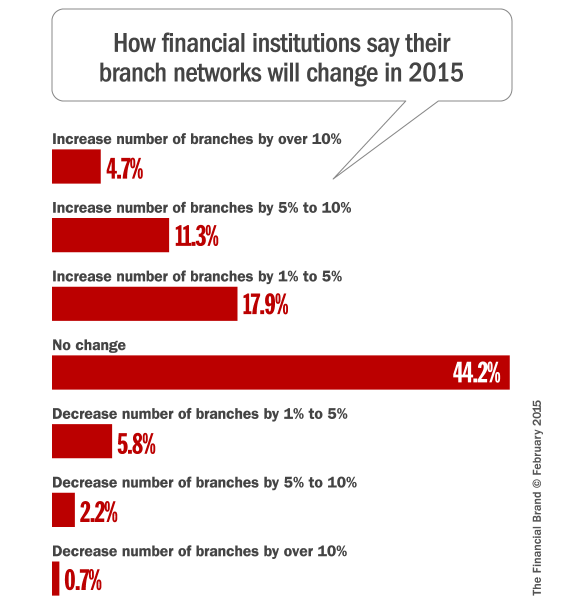
One in three financial institutions say they intend to open branches this year. Only 8.76% of banks and credit unions say they anticipate a net reduction in the size of their branch networks in 2015 — that’s 1 in 11 institutions. 44.2% of respondents say they expect no change in the number of branches they currently operate.
Tools Used to Build & Manage the Brand
| — Yes — | — No — | Not Yet, But Plan To |
|
|---|---|---|---|
| Brand guidelines/manual or booklet for employees |
49.4% | 27.4% | 17.4% |
| Design guidelines, brand standards manual or style guide |
62.7% | 19.9% | 12.4% |
| New employees receive brand orientation/training |
50.0% | 25.0% | 19.2% |
| On-going/regular brand training for all employees |
26.7% | 45.0% | 21.7% |


