Most bankers recognize that the purpose of bank branches — and the value to consumers who use them — is changing. The impact of new, digital banking channels and the drain on the balance sheet that branches often represent is prompting critical discussions and decisions in board meetings. Financial institutions are being forced to make strategic choices about whether branch locations are maintained, closed or transformed.
Available technology (e.g. iPhone, iPad, etc.) and disruption from innovations like Apple Pay, Lending Club, Square or Balance Financial (Walgreens) reflect a shift in the collective consumer mindset that takes geography out of the picture and moves banking into a mostly digital space. Determining how to compete in this new reality is a complex issue that will require input from every area of your organization. Begin with an enterprise-wide dialogue around questions like these:
- How should the branch evolve in light of market conditions?
- Are our branches focused on the right activities?
- How do we cost effectively serve retail and small business customers?
- What do people want (and do) when they visit a branch?
- How does the branch experience align with call center and/or digital channels?
The conversations generated by the above-listed questions will help frame a simple, three-part process: Research, Review and Rethink. The salient data/insights you learn about your markets and branch footprint through this process will not only validate or challenge your overall business strategy, but will also help establish metrics (triggers) and guide choices for making decisions to keep, close or transform.
1. Research What Matters (Know your Market)
When advising clients or speaking at conferences we routinely emphasize the importance of knowing your market — that is the foundation for all of your decisions, and absolutely the place you must begin this journey.
With nationwide (and worldwide) trends in de-population of smaller communities and increasing urbanization of larger cities, and technology-supported changes in consumer behavior, vacant branch lobbies and empty drive-through lanes are an increasing issue, sometimes even in booming communities. So what research should you explore, how do you make the sometimes difficult decisions and how do you prioritize resources?
Start with the micro view (your branch trade area) and learn what you can about which customers bank at (or are assigned to) a particular branch, what they buy (financial propensity), and how they prefer to access services (transaction and channel behavior).
Most banks have a wealth of data about their customers but are hesitant to use it due to privacy and regulatory issues. Your core system and/or your MCIF should be able to provide you with the following data insights to help assess your situation and establish a foundation for decision-making.
- Customer Types – What types of customers are served by the branch (i.e.: upscale, middle income, business, etc.). This could include a customer breakdown by life stage segment, such as Nielsen P$YCLE segments, which are strong predictors of customer needs, channel preferences, etc.
- Transaction Mix – Identify branch and overall channel preferences of your customers (i.e.: look at teller arrivals, personal banking arrivals, deposits/square foot, % of branch customers banking online, P2P, etc.); including the transaction patterns of people who never visit any of your branches.
- Existing Product Mix – Look at your product mix (especially on the deposit side) to determine the split between time -vs- core deposits, and how these various account holders are interacting with your bank or credit union.
- Branch Assignment – Are customers assigned to each branch based on where they transact most frequently, or are they assigned based on where their account was originally opened? The latter can lead to incorrect assumptions and faulty decisions about specific branches.
- Map Your Data – Map each branch’s customers to obtain a visual picture of the geographic dispersion of your customer, as well as account and transaction activity. Identify whether multiple branch locations overlap within your footprint.
A second layer of necessary insights involves market level data, which can help you gauge the geographic trajectory of your markets; customer, product, or channel penetration rates; and growth potential for deposits, loans, etc. at each branch. It can also allow you to conduct a comparative (gap) analysis between your customers and the market. The following insights can help you get started:
- Market Demographic Trajectory – Look at market density (i.e.: current household and business breakdown), market quality (i.e.: household income, business type, etc.), and projected market growth or decline in both of these areas
- Market Level Life Stage Segmentation – Compare this data to your own customer-specific life stage data described above. Do your customers match the overall market profile and are you serving their needs for financial products and services?
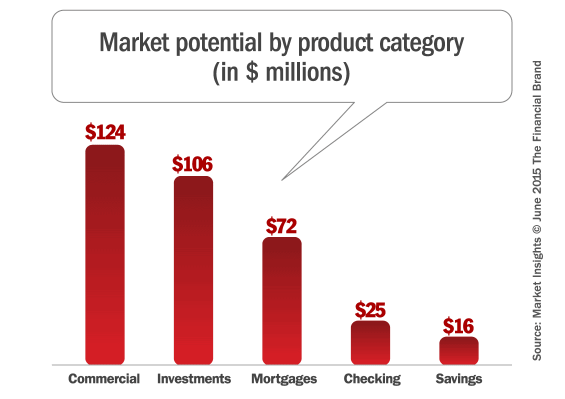
- Financial Demand – Analyze the available potential for products/services such as mortgages, investments, checking, etc. and the projected product mix based on financial demand. This will provide perspective on what is available to “sell” (compared to what you currently have) and will drive ongoing decisions about staffing, technology needs, etc.
- Competitive Climate – Compare the composition and strategic focus of your competitors, including not only regional banks and credit unions, but also online banks and financial service alternatives such as GoBank and Lending Club. What expectations do they establish for customers?
The chart and graph below depict examples of market level data for the demographic trajectory of three different markets (A, B and C), as well as the financial demand/product potential and how they can be used to guide decision-making. As you can see, the 3-mile trade area (Market A) has the greatest household/business density, while the quality (home value, income, etc.) of Market B is the strongest, and the larger 5-mile area of Market C is in population decline.
2015 Housing Stats
| Market Overview | Market A | Market B | Market C |
|---|---|---|---|
| Distance | 3 miles | 2 miles | 5 miles |
| Population (2015) | 66,033 | 24,318 | 16,893 |
| % of Population Growth (2015 to 2020) | 4.4% | 4.7% | -2.3% |
| Households (2015) | 25,014 | 8,842 | 3,464 |
| % of Household Growth (2015 to 2020) | 4.6% | 4.8% | -1.0% |
| Average Household Income (2015) | $78,598 | $98,207 | $70,885 |
| Owner Occupied Housing Units (2015) | 74.0% | 82.1% | 81.3% |
| Median Value of Owner Occupied Housing Units (2015) | $165,160 | $187,124 | $157,300 |
| Total Number of Businesses | 2,657 | 829 | 410 |
Note: Different radii are used (Market A = 3 mile, Market B = 2 mile, Market C = 5 mile) to reflect distinctive market types and the retail/commercial draw around particular branch locations.
2. Review the Metrics of Optimization and Consolidation
Analysis of the customer and market level data will help you draw conclusions for each market and each branch in your network. As referenced earlier, this analysis must be done within the broader context of your overall business strategy — sometimes validating your goals, sometimes causing you to adjust objectives. Either way, the first step will help clarify your greatest opportunities and allow you to apply that knowledge to choices about your branches. A review of the following branch-specific metrics is the next important step:
Staffing Model – Determine how can you re-align the composition of branch staff to match market opportunity (i.e. enhance capacity for commercial lending, investments, mortgages, etc.)? What are the budget implications? Do you switch to a Universal Banker model? Do you convert certain branches into teller-less locations?
Technology/Equipment – Assess the current inventory of ATMs, video ATMs/conferencing equipment, cash recyclers, etc.
Activities Analysis – Conduct an analysis of what customers do at a branch, whether technology could assist with these activities. Also assess teller and personal banker activities (i.e. appointment scheduling, meeting follow-up, etc.) that could be enhanced through technology.
Interaction with Other Branches – Determine how (if at all) one branch interacts with another branch. Do they offer complimentary (but non-overlapping) services? Does one serve as a more limited service “spoke” to a full service “hub” in the same community?
A clearer picture for a potential mix of branch types should begin to emerge.
3. Rethink the Branch
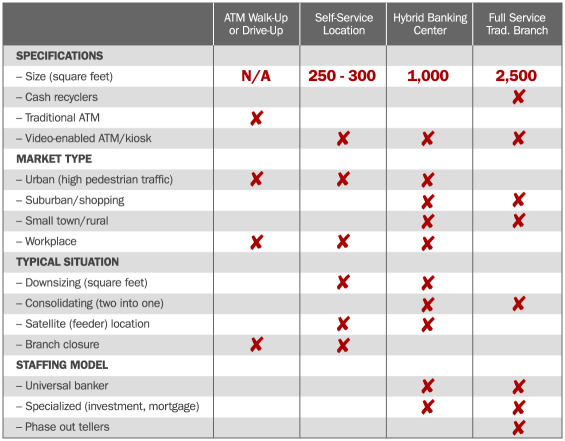
The branch is rapidly evolving to accommodate changing banking behaviors, different ways of engaging consumers and deploying more highly trained staff in smaller spaces. The Delivery Stratification Scenarios table below offers a framework to help you classify your branches based on the research you have conducted (above) and different branch types.
As outlined, this three-part methodology may seem rather simple. The specifics, of course, can be rather complex and require focused attention. Nevertheless, the result can help you and your team build consensus around the choices that need to be made regarding your branch network. While every institution and every market is unique, we find these basic triggers often apply:
Triggers Indicative of When to Keep/Retain a Branch:
- Serves a defined niche (i.e.: colleges, workplace, small business, investment services, etc.)
- High volume branch (i.e.: transactions, personal banking sessions, etc.)
- Provides a positive net profit contribution to the enterprise
- Serves as a billboard for increasing brand awareness and drives people to your other channels
Triggers Indicative of When to Close/Consolidate Branches:
- Declining population and household growth
- Geographic overlap with another one of your branch locations
- Deposit mix is primarily time deposits (i.e.: CDs, IRA, etc.) where customer visits are infrequent
- Households per branch are generally less than 500 (subject to individual market conditions)
Triggers Indicative of When to Transform/Reconfigure:
- The branch is (or should be) part of a modified hub and spoke concept where multiple branches in a market are interdependent on each other and have complimentary strategic areas of focus
- The function of the branch is more often interaction rather than transaction
You will, of course, identify your own distinctive triggers aligned with your market(s) and strategic goals, and this process must be ongoing. The variables impacting the evolution of branch delivery will continue to change — including the most important one: your customer.