What Bang Do Financial Marketers Get for Their Bucks?
Spending more on marketing garnered more loans and deposits for institutions budgeting more for promotion in 2023 (with one exception). But the bigger spenders didn't see improvement in revenue, with the exception of those in the largest bank asset-size class.
By Ally Akins, Claude Hanley & Trevor Fox, Capital Performance Group
Simple Subscribe
Subscribe Now!
In the face of profitability challenges, banks and credit unions face immense pressure to reduce operating costs and streamline operations. Marketing budgets are often among the first to be cut. In 2023, the largest and smallest banks increased their marketing budgets the most and saw superior growth as well. This trend was even more dramatic within a group of fintech bank holding companies, where much larger marketing budgets contributed to faster growth.
These findings underscore how critical marketing can be to the industry’s top performers.
Yet banks grew marketing more slowly in 2023 than in 2022, highlighting constrained budgets in 2023 as banks of all sizes faced economic headwinds due to increased interest rates and compressed margins. While banks with marketing spend reported managed to grow deposits and loans faster than their counterparts without marketing spend reported, revenue growth remained a challenge in 2023.
Banks with marketing expense reported managed to maintain higher loan-to-deposit ratios, while growing both loans and deposits, indicating that investment in marketing produced growth which helped banks’ overall performance, even in a cloudy economic environment.
Overall trends suggest improved growth metrics for banks with marketing spend, but there is never a 100% correlation between the two. Indeed, a direct correlation between marketing spending and financial performance is not possible. That’s because many factors beyond marketing impact how profitable a bank is. Additionally, banks maintain many business lines and run initiatives that marketing has no control over.
How the Study on Marketing Spend was Conducted
Capital Performance Group (CPG), a management consulting firm dedicated to the financial services industry, and The Financial Brand partnered to analyze banks’ marketing budgets and assess how marketing spend may have influenced financial performance.
CPG grouped FDIC-insured institutions into four asset tiers (less than $2.0 billion, $2-$10 billion, $10-$50 billion, and above $50 billion) to track trends in marketing spend and financial performance from 2022-2023. To ensure standardization in the definition of marketing expense, CPG’s analysis draws on data from the Federal Deposit Insurance Corp., using the annual “advertising and marketing expenses” item in call reports. Note that not every marketing expense gets rolled up into this line item. Salaries of marketing personnel, for example, are not included, but marketing, advertising and promotional spending are.
This year, Capital Performance Group also created a peer fintech bank holding company group, comprised of nine direct-to-consumer, publicly traded fintech bank holding companies. (See analysis and data in the last section of this article.)
Banks are only required to submit information for the advertising and marketing expenses line item in the year-end call report when advertising and marketing expenditures total $100,000 or more and when these expenses exceed 7% of total “other noninterest expenses.” (For this reason the group of the largest banks studied is relatively small.)
Thus, the “reporting banks” are, by definition, investing more in marketing than those that don’t report marketing expenses. In the article, CPG compares the banks that reported marketing expense to those that did not report marketing expense to examine the difference in performance across a variety of key metrics.
Read more: How to Fight for Your Marketing Budget Today … and All Year
How Bank Marketing Budgets Stacked Up In 2023
CPG first evaluated the size of a bank’s marketing budget by measuring the marketing expense reported as a percentage of the bank’s total noninterest expense. This gives a sense of how significant marketing is relative to the bank’s total budget. CPG also studied the percent of average assets a marketing budget would make up, which can give banks a good benchmark to use against similar banks and operating models.
Marketing spend ratios, by asset tiers, for 2023
Source: Capital Performance Group analysis of FDIC dataWhile the largest banks ($50 billion-plus) clearly spent the most on marketing, there is no linear progression of size versus marketing spend for the smaller banks. Banks under $50 billion in assets spent between around 3.0%-3.1% of their budgets on marketing, while the largest bank group spent 3.9%, indicating the smaller banks may need to think about spending more on marketing to compete with the larger regional and national bank brands.
Read more: Pay for Performance: The Tactic Saving Marketing Budgets in 2024
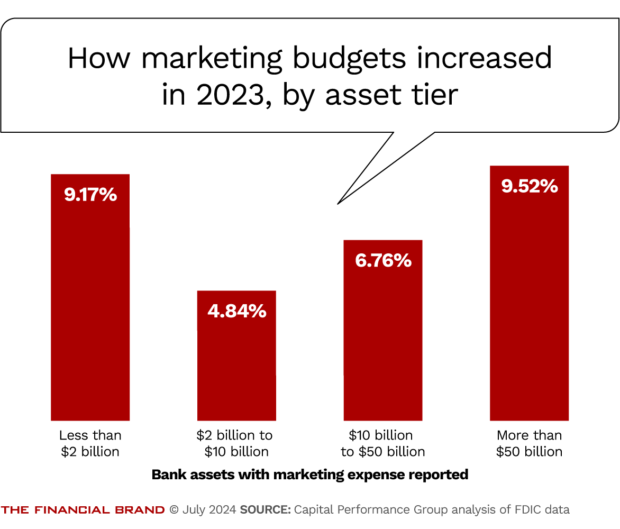
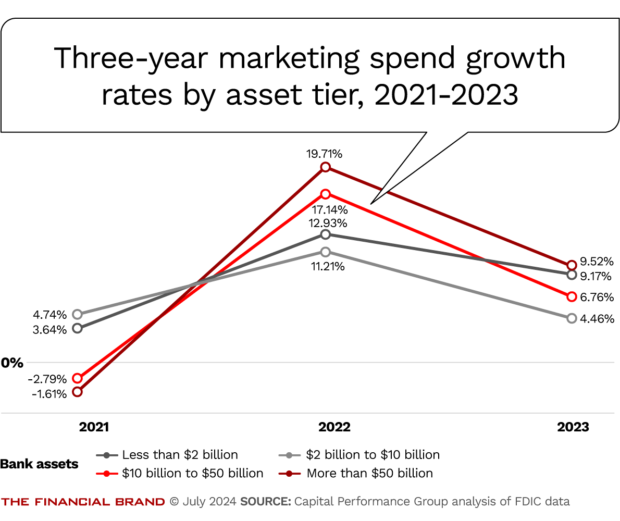
Where Marketing Budgets Increased in 2023
The smallest and largest banks also increased their marketing budgets more significantly last year than their mid-size counterparts. While all asset tiers grew marketing spending by at least 4% in 2023, among those reporting budget numbers, the annual increase was much lower than in 2022.
This slowdown in the growth rate likely reflects the industry-wide focus on expense control due to the contraction in net interest margins that occurred last year.
Read more: How CMOs Can Maximize Their Marketing Budgets & Prevent Cuts
Where are the Payoffs for Spending More on Bank Marketing?
When comparing banks with marketing spend (a proxy for those who invested more of their budgets in marketing in 2023) to banks that did not report marketing spend, there are a few areas where performance may have been impacted.
For example, all groups except the $10-$50 billion banks grew loans faster than their counterparts that did not report marketing spend.
All groups reporting marketing spending grew deposits, and all groups who spent more on marketing (except the $10-$50 billion banks) outperformed those who didn’t in deposit growth as well. This was a differentiator in a difficult year. Banks that were able to grow deposits without reliance on brokered funds were able to contribute more significantly to their institution’s profitability.
Does spending more on marketing contribute to better results?
Source: Capital Performance Group analysis of FDIC dataOnly the largest banks managed to grow revenue faster than their non-marketing spend peers, while the banks under $50 billion saw worse negative revenue change year over year than their peers. Growing revenue remained an industry-wide challenge as banks fought for funding sources and competed against rivals of all kinds for deposits.
This highlights the point that even though marketing may have contributed to growth of loan and deposit accounts, in the current environment it was not enough to shift revenue tides.
This trend could also have been influenced by the slowdown in marketing investment from 2022-2023, as in 2022, banks with reported marketing spend across most asset tiers also drove more revenue growth.
For every group except the $2-$10 billion tier, those institutions with marketing expenses produced better loan-to-deposit ratios than those without. In a year of oft-competing priorities, where banks balanced solidifying funding sources with maintaining a profitable margin, institutions in three out of four categories that spent more on marketing were able to maintain higher levels of lending.
Read more: How CMOs Can Maximize Their Marketing Budgets & Prevent Cuts
Fighting with ‘Fintech Banks’: An Uneven Playing Field
CPG also compared traditional banks to the direct-to-consumer fintech bank holding company peer group for a consistent comparison of marketing expenses and performance trends. The reporting requirements for these bank holding companies are identical to those of traditional banks.
These holding companies were much larger than the other bank asset tiers (average assets of $134.0 billion) and did not rely on branches or a physical distribution network (six branches average and none for some) to maintain and grow their businesses. (On average, these institutions had six branches, if any.)
The nine institutions examined include: American Express Co., Capital One Financial Corp., Discover Financial Services, Green Dot Corp., LendingClub Corp., SoFi Technologies, Synchrony Financial, Ally Financial and Cass Information Systems.
How fintech bank holding company marketing spend compares to traditional banks, by asset tier
Source: Capital Performance Group analysis of FDIC dataFintech bank holding companies are spending a much larger amount of their total budgets on marketing — 17.2% of noninterest expense, versus percentages below 4% for all banks. To put it plainly, if a $3 billion community bank currently is spending $2.1 million on marketing (7 basis points of total assets), a fintech bank holding company of that size would be spending $25.2 million — 84 basis points of total assets.
Also note this: Fintech bank holding companies grew their marketing budgets at a similar pace to banks last year — 4.33% — but their loan growth, deposit growth and revenue growth far surpassed that of traditional banks. This came at a disadvantage to their cost of funds, but their efficient operating models and business lines allowed them to maintain profitability in a difficult year.
American Express was the fintech bank holding company that spent the most on marketing in 2023. As a result, Amex was able to generate non-brokered deposit growth of 23.7% which allowed the company to dramatically grow loans to consumers and businesses.
The technological advancements of online account opening and online banking have brought these direct-to-consumer fintechs into fierce competition with banks of all sizes across all markets. Banks are being forced to compete with these large national brands that are playing a different game, with drastically different resources.
Read more: The Right and Wrong Way to Cut a Bank Marketing Budget
Fueling Bank Growth with Marketing Dollars
Institutions that spent more on marketing generally grew deposits and loans faster last year, with the exception noted. While that loan and deposit growth helped those banks in a tough economic year, it did not necessarily translate into revenue growth in 2023.
What can institutions do in the immediate future?
In 2024 and beyond, financial marketers will need to prioritize revenue growth opportunities to support their institutions. Marketers can’t control their institution’s ability to remain profitable and to grow profitability further. However, they can contribute to their institution’s growth goals through targeted customer growth initiatives and campaigns that aim for customer retention and relationship-deepening.
This study provides helpful benchmarks for any institution trying to determine how much they should be spending and what kind of growth they should expect, as competition intensifies, and banks compete against large and digital brands with hefty marketing budgets.
There is no one right answer to determining exactly how large your bank’s marketing budget should be. But comparing your institution to peers of similar business models and competitors ensures you have a fighting chance.
Ally Akins is a consultant with Capital Performance Group. Claude Hanley is a partner with the firm. Trevor Fox is a senior business analyst. For details about the study and access to the full data and analysis, please contact Akins at aakins@capitalperform.com.