
Marketing Spend Benchmarks: How Much are Banks Really Investing?
By Ally Akins, Claude Hanley, and Matthew Prince, Capital Performance Group
Simple Subscribe
Subscribe Now!
Does your bank make a serious investment in marketing or just the bare minimum? If you do put some chips on marketing, is your institution getting the payoff it hopes for?
In the first installment of a series, we examine how much banks are spending on marketing relative to their overall budgets and assets, the rebound in marketing investment in 2025, and how traditional banks stack up against fintech competitors on spend alone.
For the first time in this annual analysis, we also pull in banks that reported marketing expense to the Securities and Exchange Commission, which added a nice set of banks that do not typically qualify for reporting marketing expense under federal bank regulators’ call report instructions.
The second part of the series dives into the impact on performance — specifically, how marketing investment levels correlate with growth in loans, deposits and revenue.
Read a companion report about credit union marketing spending.
Need to Know:
- Marketing investment is accelerating across the banking industry, yet the gap between traditional banks and fintech competitors continues to widen.
- In 2025, marketing spend growth rebounded across both small and midsize banks, reversing the slowdown seen in prior years.
- At the same time, marketing remains a relatively small share of overall expenses.
- The analysis finds that fintech bank holding companies have a competitive edge due to their significantly higher marketing spend.
Analysis Methodology
This article delves into the findings of a comprehensive analysis conducted by Capital Performance Group (CPG) in partnership with The Financial Brand.
The study examines the marketing budgets of FDIC-insured institutions, segmented into two asset tiers: $1 billion-$10 billion and over $10 billion-$100 billion. The analyses uses 2025 yearend call report data, with year-over-year comparisons to 2024. To ensure standardization in the definition of marketing expense, CPG’s analysis draws on data from the Federal Deposit Insurance Corp., using the annual “advertising and marketing expenses” item in call reports.
Note that not every marketing expense gets rolled up into this line item. For example, marketing personnel salaries are not included, but marketing, advertising and promotional spending are.
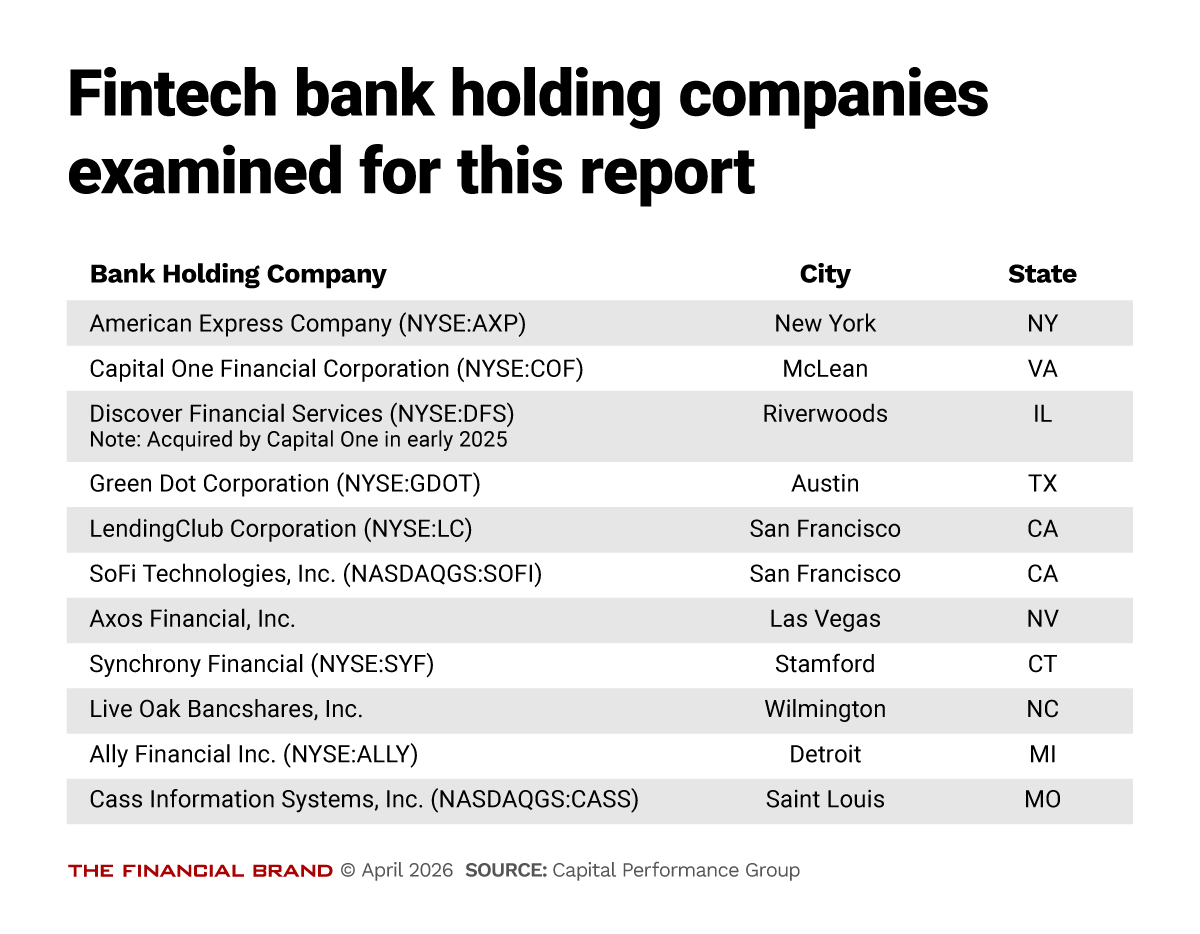
CPG’s analysis also tracks a peer fintech bank holding company group, comprised of 11 direct-to-consumer, publicly traded fintech bank holding companies. (See the analysis and data in the last section of this article.)
Banks are only required to submit information for the advertising and marketing expenses line item in the yearend call report when advertising and marketing expenditures total $100,000 or more and when these expenses exceed 7% of total “other noninterest expenses.”
For institutions that did not report marketing expense on the call report, but did report Advertising Expense on SEC filings, the bank’s SEC marketing expense was used. Under generally accepted accounting principles, advertising costs are defined as activities undertaken to promote an entity’s products, services, or brand to the public.
Examining the Size of Bank Marketing Budgets in 2025
CPG first evaluated the size of a bank’s marketing budget by measuring the marketing expense reported as a percentage of the bank’s total noninterest expense. This shows how significant marketing is relative to the bank’s total budget. CPG also studied the percentage of average assets that a marketing budget would comprise, providing banks with a good benchmark against similar banks and operating models.
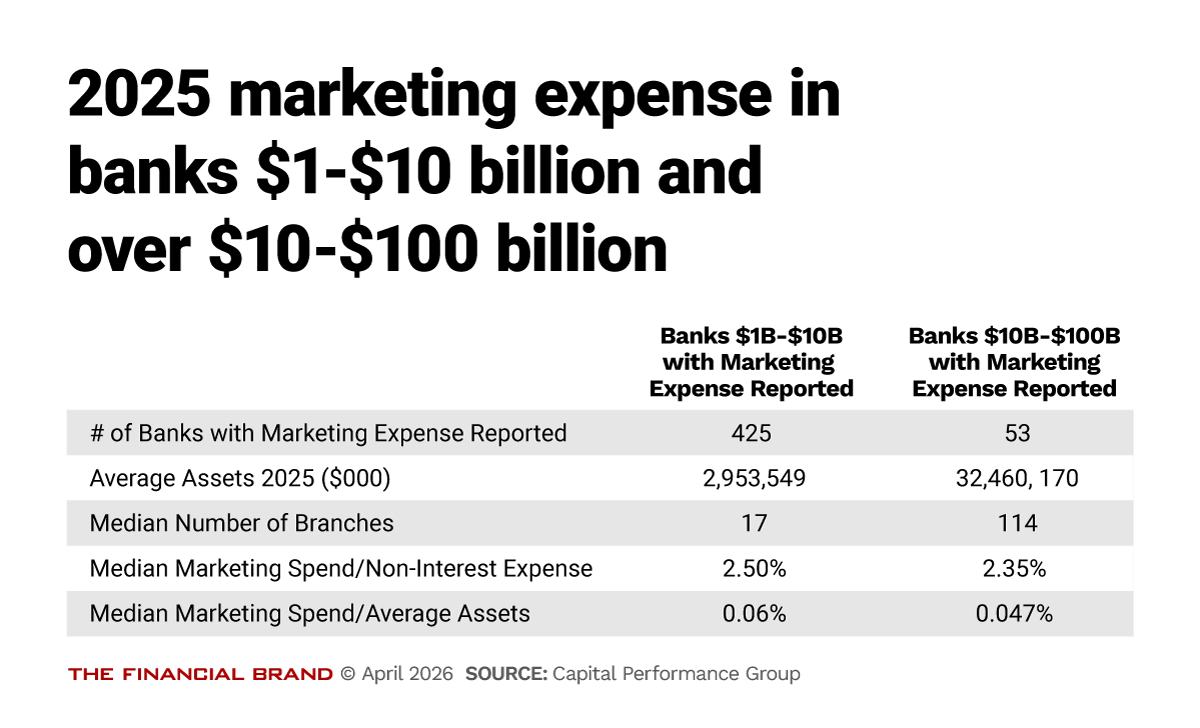
Smaller banks (banks $1 billion-$10 billion) typically spend 2.5% of their noninterest expense budgets on marketing, which accounts for 6 basis points of their total assets, whereas midsize banks ($10 billion-$100 billion) spend slightly less, 2.35% of their noninterest expense budget and 5 basis points of assets.
Marketing Budgets Rebound in 2025
After several years of tepid growth, bank marketing budgets staged a meaningful comeback in 2025. For both asset groups, marketing expense as a percentage of total assets and noninterest expense increased year-over-year — and critically, the rate of growth itself accelerated.
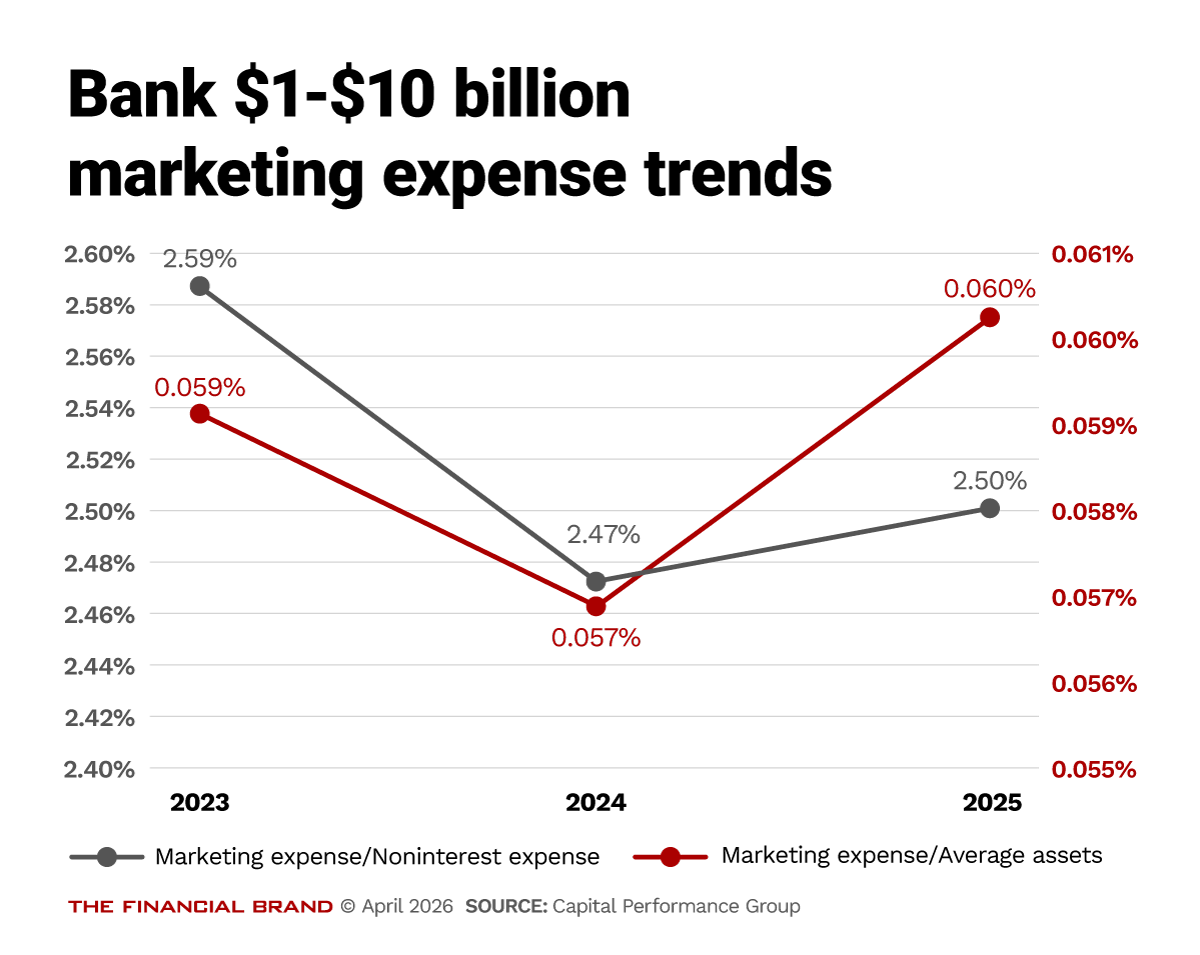
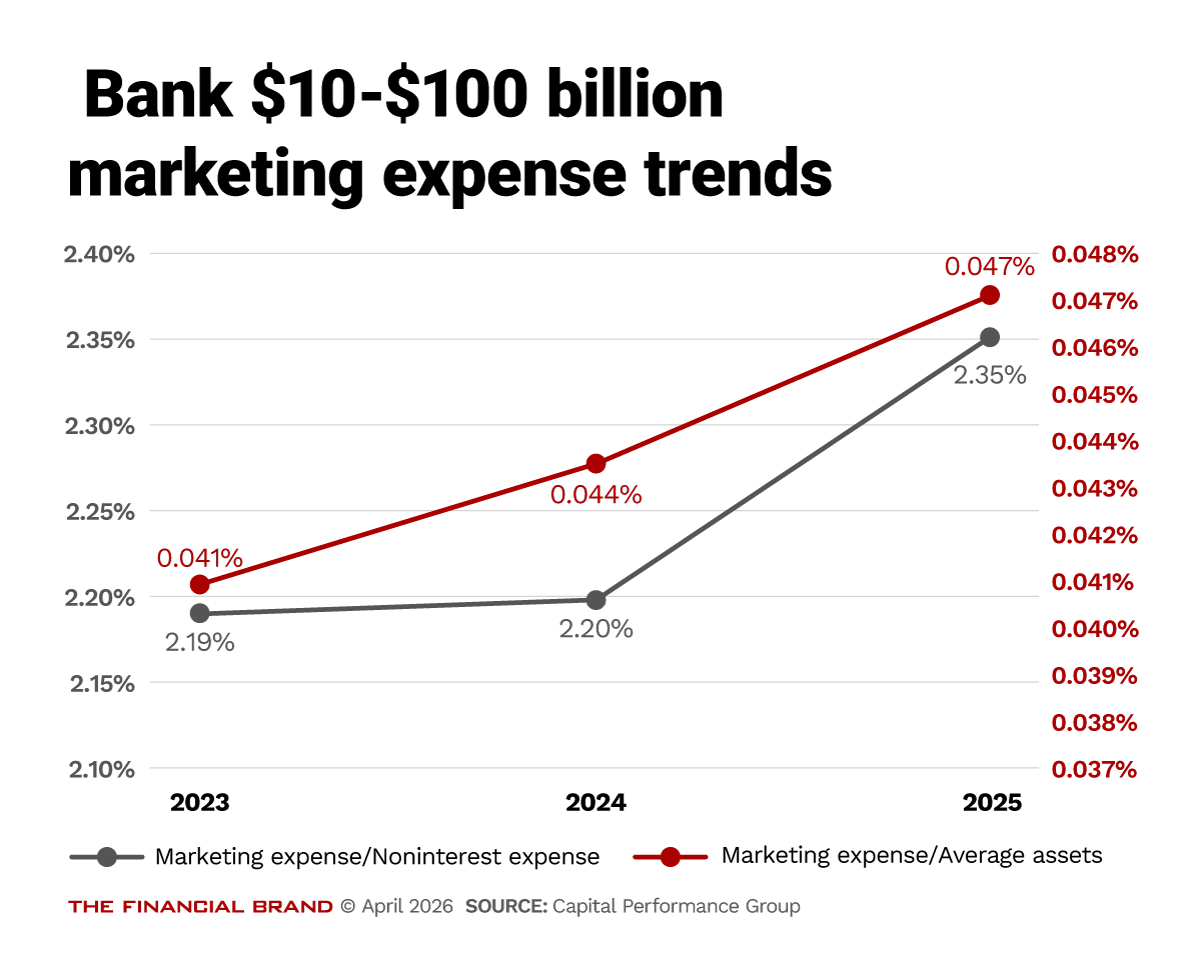
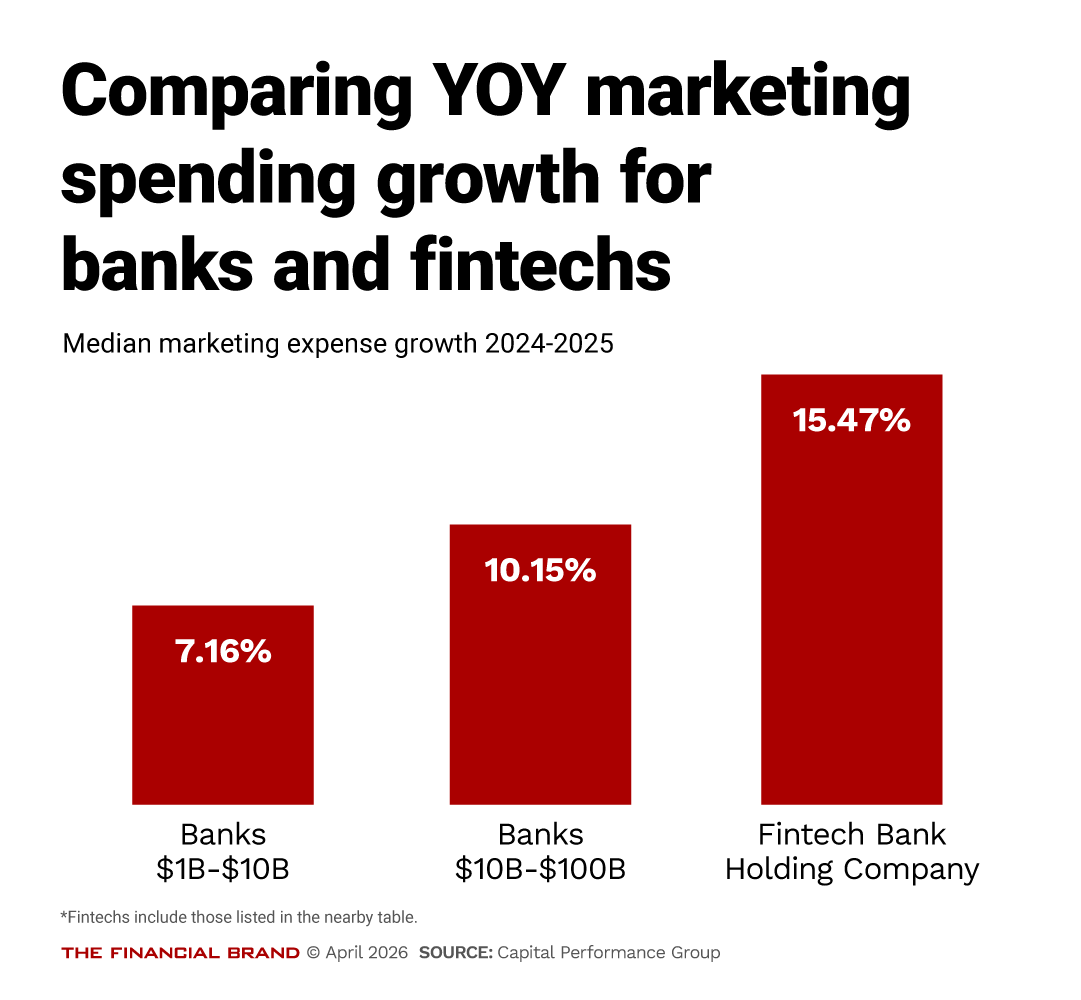
Smaller banks ($1 billion–$10 billion) grew their marketing budgets by 7.16% in 2025, while midsize banks (over $10 billion–$100 billion) posted even stronger growth of 10.15%.
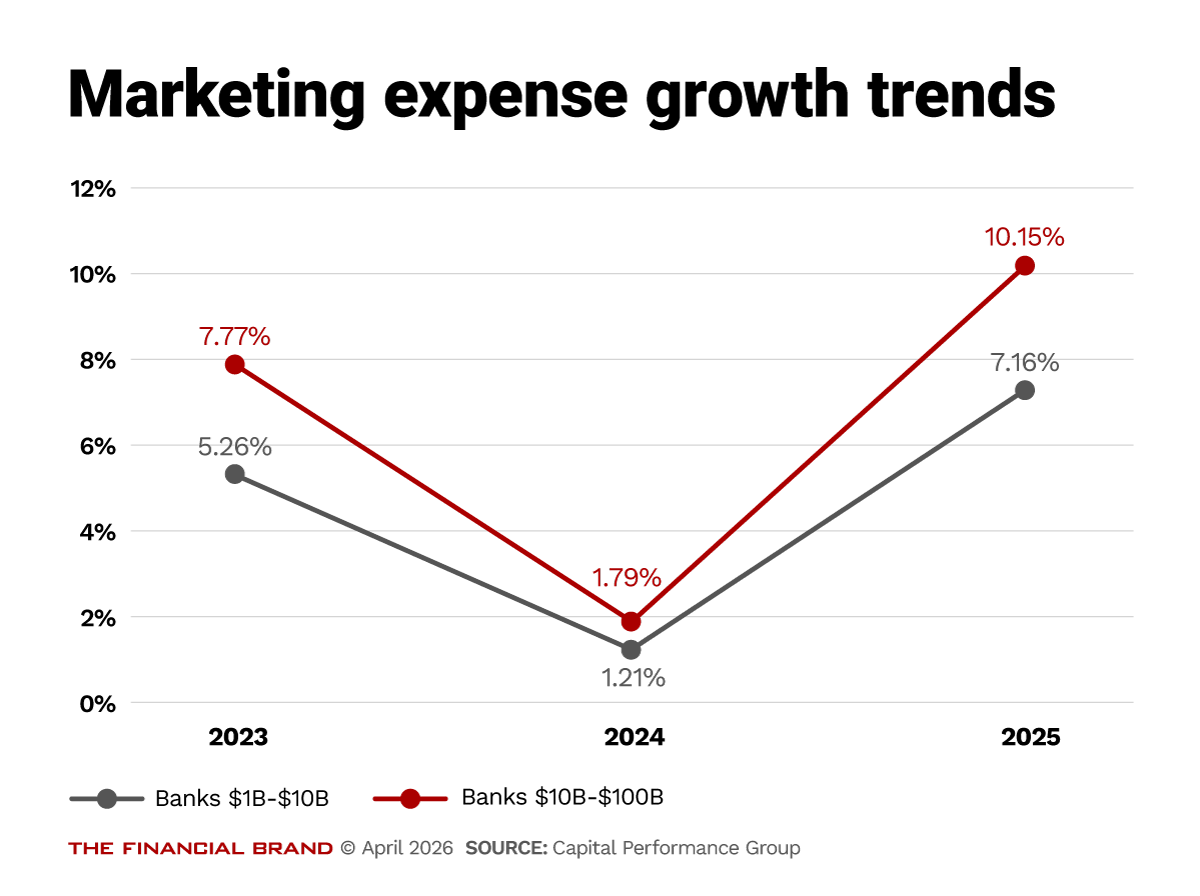
Key trend: Both figures represent a significant reversal from the declining growth trend seen in prior years, and mark the highest levels of marketing investment growth recorded in the last five years.
This rebound likely reflects a combination of factors, among them:
• Renewed pressure from digital competitors.
• Post-pandemic normalization of customer acquisition costs.
• Growing recognition among bank leaders that marketing is a revenue-linked function — not simply a discretionary expense.
As deposit competition intensified and loan growth slowed in many markets, banks appear to have responded by leaning into marketing rather than pulling back.
Reality check: Marketing remains a relatively modest line item — 2.5% of noninterest expense for smaller banks and 2.35% for midsize institutions.
Read more: To Win Against the Big Banks, Smaller Institutions Must Go on the Offensive
Fighting with Fintechs: An Uneven Playing Field for Spending
CPG also compared spending by traditional banks to the direct-to-consumer fintech bank holding company peer group (11 institutions, in the table below) for a consistent comparison of marketing spend trends across the group. (The reporting requirements for these bank holding companies are identical to those of traditional banks.)
These holding companies were much larger than the other bank asset tiers (average assets of $130.5 billion) and did not rely on branches or a physical distribution network (median of only three branches) to maintain and grow their businesses. Additionally, many of these fintech bank holding companies rely on business models centered on consumer lending/credit cards.
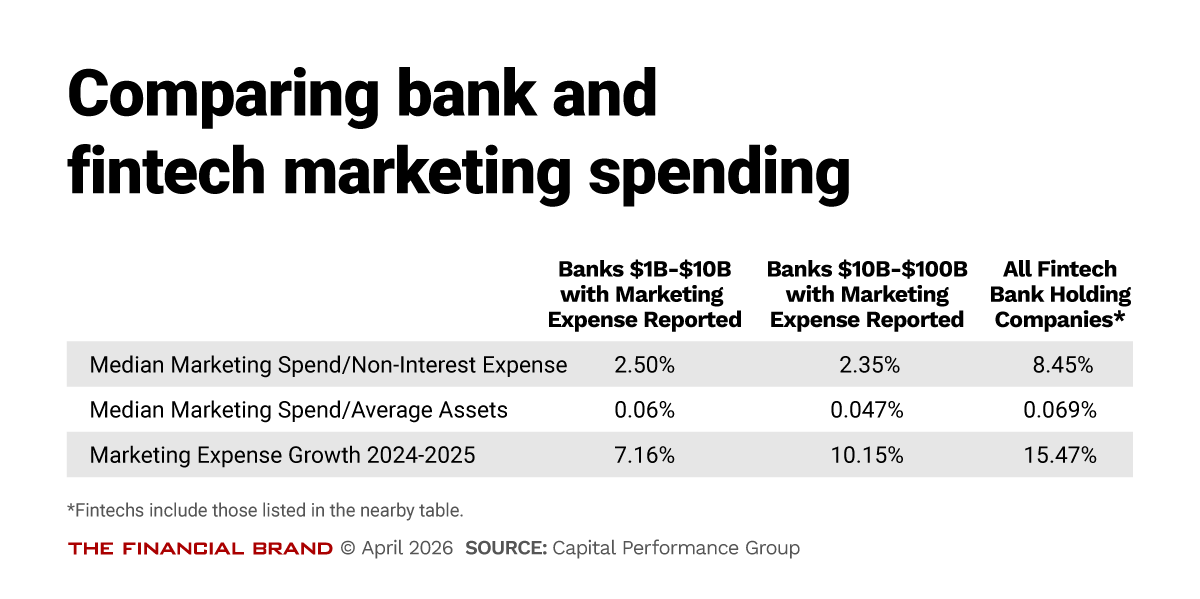
Key insight: While banks are increasing marketing investment, fintech competitors continue to operate at a fundamentally different scale. This trend reinforces both the importance of marketing and the challenge of competing on marketing spend alone when facing behemoths’ deep pockets.
Fintech bank holding companies spend significantly more on marketing compared to the rest of their budgets: 8.45% of noninterest expense versus percentages below 2.5% for all banks studied.
They also grew their marketing budgets twice as fast as smaller bank peers.
Read more: Why ‘No’ Is the Most Expensive Word in the Boardroom
Marketing’s Rising Strategic Role
Marketing remains a relatively small share of total expense — approximately 2.3%–2.5% of noninterest expense and 5–6 basis points of assets among the bank groups studied — yet its strategic importance is growing.
After a period of slower growth, 2025 marked a clear rebound in marketing investment across both community and midsize banks, signaling renewed confidence in marketing as a competitive lever.
Strategic challenge: However, the gap between traditional banks and fintech competitors remains substantial.
Fintech bank holding companies dedicate more than three times the share of their budgets to marketing, and they grew those budgets faster in 2025. For traditional banks, this reinforces a familiar challenge: competing for customers in an environment where digitally native brands operate at a fundamentally different investment scale.
A caveat: What these benchmarks can’t tell you is whether more spend automatically translates to better outcomes — that relationship will be explored in Part 2 of this series. What benchmarks do tell you is where the industry is headed and how your institution compares.
Benchmarking should always be viewed in context. Differences in business models, line-of-business mix, geographic focus, and growth strategy can all materially influence what “good” looks like. High-level comparisons are a useful starting point, but institutions should go deeper to understand the drivers behind peer performance before setting their own targets.
For details about the study and access to the full data , please contact Ally Akins at aakins@capitalperform.com
Read Part 2 of this two-part report: Marketing Spend Benchmarks: The Impact of Higher Budgets Shifts to Income and Profit Generation
Read last year’s analysis by CPG: The Growth Secret of Fast Growing Small and Midsize Banks: Marketing Matters


