
Marketing Budgets Increase, Shift to Income and Profit Generation
By Ally Akins, Claude Hanley, and Matthew Prince, Capital Performance Group
Simple Subscribe
Subscribe Now!
Does increased marketing investment actually translate into better financial performance for banks?
In the second installment of this series, we move beyond examining spending levels, covered in Part 1, to analyzing outcomes — specifically, how marketing investment correlates with growth, revenue and profitability across the banking industry.
Using FDIC call report data, this analysis evaluated banks across two asset tiers ($1–$10 billion and over $10–$100 billion) to better understand how marketing dollars influenced performance in 2025.
Key insight: While marketing has long been associated with stronger loan and deposit growth, the latest data suggests its role is evolving.
In 2025, we have found, marketing was increasingly tied to revenue generation, efficiency and profitability, rather than solely balance sheet growth.
At the same time, fintech competitors continued to invest significantly more in marketing.
In this report, we break down where marketing is having the greatest impact — and where it isn’t — to help bank leaders better understand how to align marketing investment with financial performance.
Need to Know:
- Marketing investment was increasingly linked to income statement results —revenue generation and profitability — rather than just balance sheet expansion.
- Banks generated stronger returns on marketing spend, with revenue per dollar of marketing improving across both community and midsize institutions.
- Larger banks showed a more nuanced relationship, where marketing supports stable financial performance but did not necessarily drive growth in loans or deposits.
- Fintech competitors continued to outspend traditional banks on marketing by a wide margin, reinforcing both the importance of marketing and the limits of competing on spending alone.
This article delves into the findings of a comprehensive analysis conducted by Capital Performance Group (CPG) in partnership with The Financial Brand. The study examines the marketing budgets of FDIC-insured institutions, segmented into two asset tiers ($1-$10 billion and over $10-$100 billion), and assesses how marketing spend may have impacted their financial performance in 2025.
However, it’s important to recognize that marketing spending and financial performance are never 100% correlated. Many factors beyond marketing impact a bank’s profitability, including economic conditions, regulatory changes and competitive actions. Additionally, banks operate multiple business lines and undertake projects that the marketing function cannot control.
Read a companion report about credit union marketing spending.
Methodology for Analyzing Marketing Spend’s Impact
CPG analyzed FDIC-insured institutions within the two asset tiers to track trends in marketing spend and financial performance from 2024-2025. To ensure standardization in the definition of marketing expense, CPG’s analysis draws on data from the Federal Deposit Insurance Corp., using the annual “advertising and marketing expenses” item in call reports.
Note that not every marketing expense gets rolled up into this line item. For example, marketing personnel salaries are excluded, but marketing, advertising and promotional spending are included. Among banks with assets $1-$10 billion, 726 were analyzed, with 565 reporting marketing spend. Among those with assets of over $10-$100 billion, 69 were analyzed, with 30 reporting marketing spend.
Banks are only required to submit information for the advertising and marketing expenses line item in the year-end call report when advertising and marketing expenditures total $100,000 or more and when these expenses exceed 7% of total “other noninterest expenses.”
Read Part 1: Marketing Spend Benchmarks: How Much are Banks Really Investing?
Marketing Spend is Increasingly Tied to Revenue and Profitability
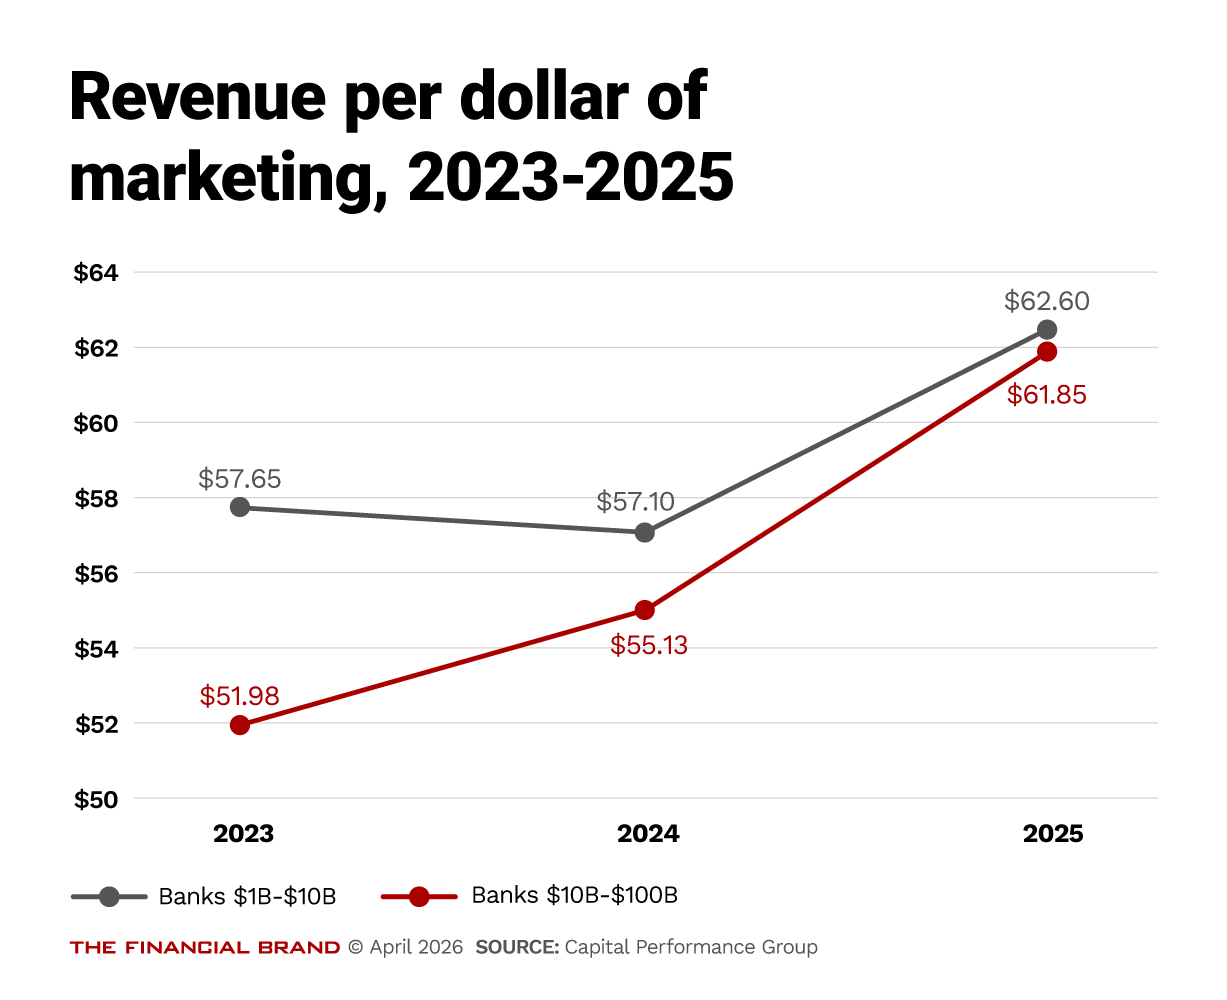
In 2025, banks with $1–$10 billion in assets generated a median of $62.60 in revenue per dollar of marketing spend, while midsize banks ($10–$100 billion) reached $61.85. These ratios strengthened from 2024 through 2025, suggesting that banks deployed marketing budgets more efficiently even as total spend grew.
This shift showed up in the performance data, when comparing banks with marketing spending (a proxy for those that invested more of their budgets in marketing in 2024) to banks that did not report marketing spending.
While effective marketing has historically been associated with stronger loan and deposit growth, the 2025 data suggest a shift in how that impact was realized. There was no material difference in loan and deposit growth between banks that invested in marketing and those that do not.
However, marketing continues to show a consistent relationship with revenue generation and profitability, especially for community banks, reinforcing its role as a driver of financial performance rather than solely a balance-sheet driver.
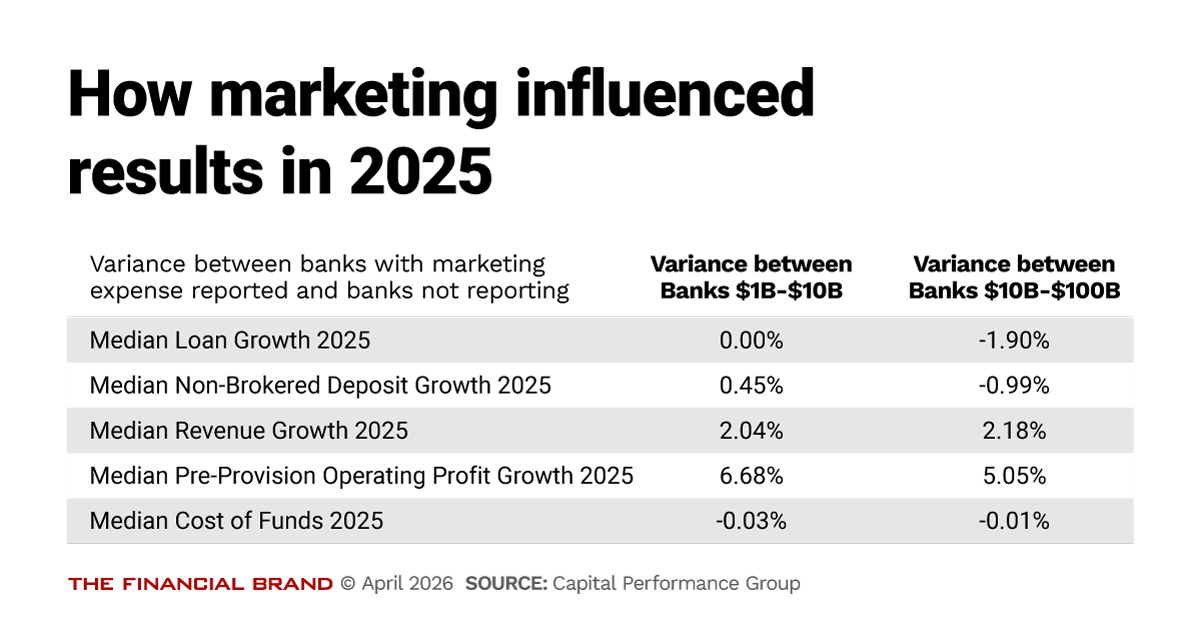
Performance booster. Among banks with $1–$10 billion in assets, performance differences were significant.
• Revenue growth was higher for banks that invest in marketing, while deposit growth was generally comparable. (We use growth in non-brokered deposits here, as a reasonable measure of the impact of marketing spending and effort.)
• Profitability showed clearer separation, with higher pre-provision operating profit growth and returns for marketing-active institutions. The variance was marked, at 6.68%.
For banks with $10–$100 billion in assets, the relationship was slightly more nuanced.
Banks investing in marketing showed slightly lower loan and deposit growth compared to peers, but higher revenue and profitability metrics.
Read more: Why ‘No’ Is the Most Expensive Word in the Boardroom
Fintech Marketing Spend Fuels Growth — at a High Price
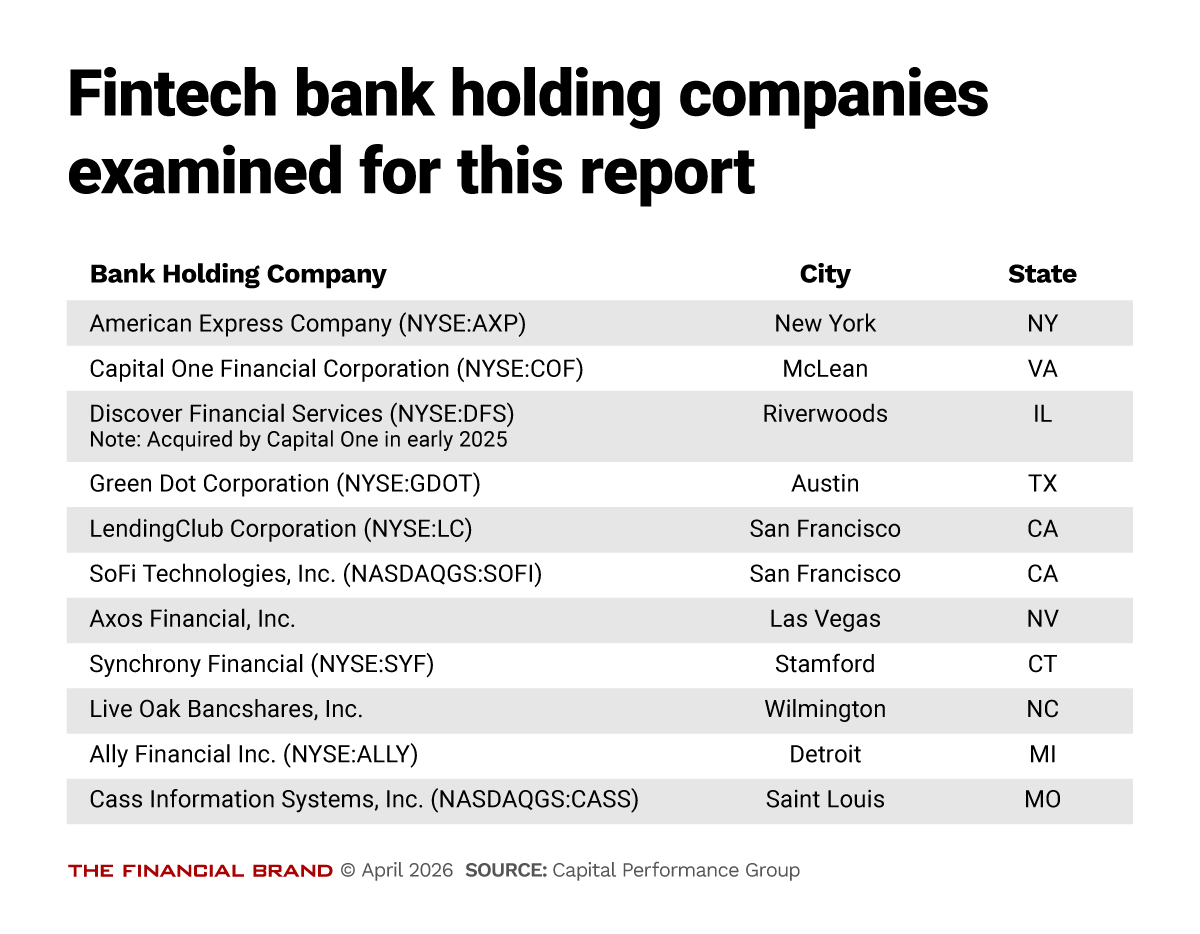
CPG also compared traditional banks to the direct-to-customer fintech bank holding company peer group (11 institutions) cited in Part 1 of this report. (The marketing expenses reporting requirements for these bank holding companies are identical to those of traditional banks.)
These fintech holding companies are much larger than the other bank asset tiers (average assets of $130.5 billion) and do not rely on branches or a physical distribution network to maintain and grow their businesses. These companies have a median of three branches.
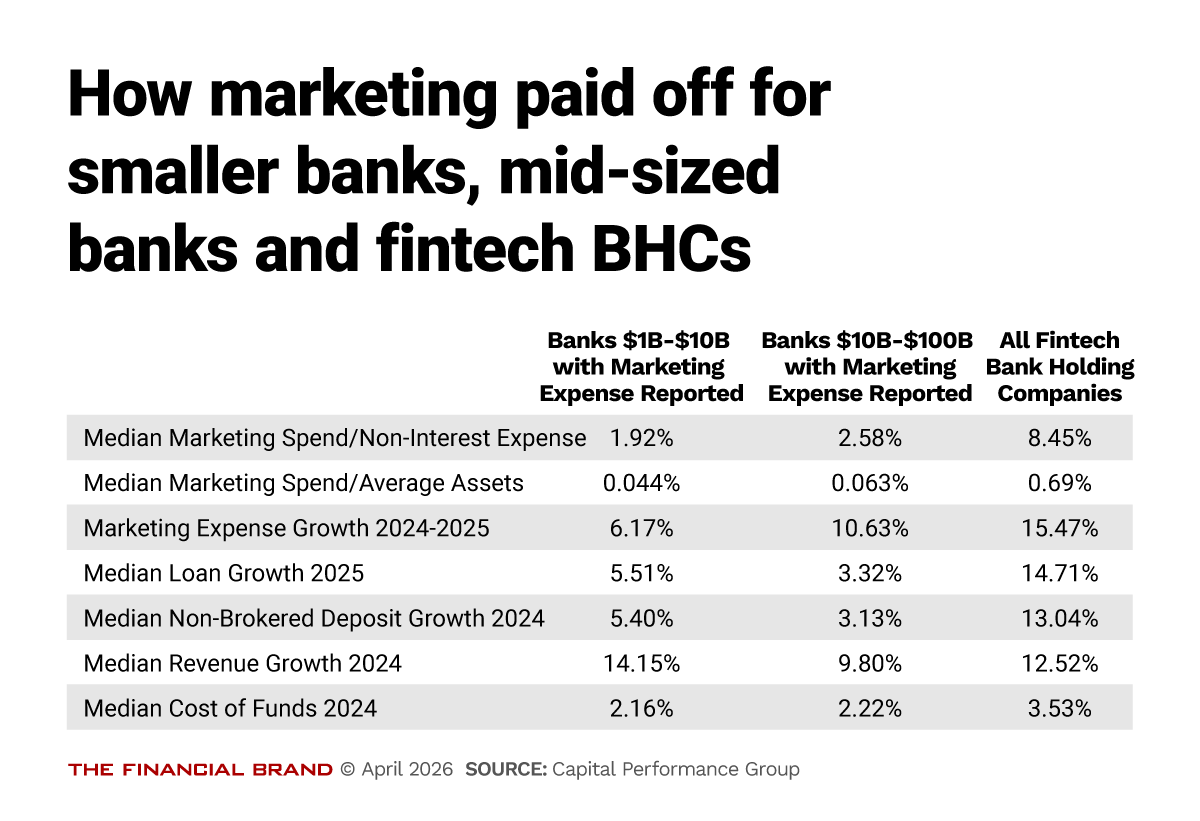
Key observation: While banks increased marketing investment, fintech competitors continued to outpace them.
As shown in the first line of the table above, fintech bank holding companies allocated significantly more of their budgets to marketing than traditional banks — 8.45% of noninterest expense, versus percentages below 2.6% for all banks.
Competitive flashpoint: Fintech bank holding companies also grew their marketing budgets much faster than banks in 2025 — 15.47%.
While their loan and deposit growth outpaced those of traditional banks, the revenue picture was mixed: Fintechs grew faster than mid-sized banks but slower than community banks.
Also, despite much higher marketing spend, fintechs relied on high-cost deposits.
Read more: This $6.9B Community Bank Competes with Chase — By Running a $1.3B Digital Brand on the Side
Fueling Banking Growth with Marketing
Marketing continues to play a critical role in bank performance — but the nature of its impact is evolving.
The 2025 data indicate that marketing is increasingly aligned with revenue generation and profitability, not just simple growth in balance sheet categories. While higher spending does not guarantee stronger results, banks that invested in marketing saw benefits across revenue growth metrics in 2025.
For details about the study and access to the full data and analysis, please contact Ally Akins at aakins@capitalperform.com.
Read last year’s analysis by CPG: The Growth Secret of Fast Growing Small and Midsize Banks: Marketing Matters


