
Credit Union Marketing Rises, But the Gap Between Large and Small Players Grows
By Ally Akins, Claude Hanley, and Matthew Prince, Capital Performance Group
Simple Subscribe
Subscribe Now!
Marketing has become an increasingly important strategic lever for credit unions as competition intensifies across deposits, loans and digital member acquisition. While credit unions have historically relied on community presence, member relationships, and branch networks to drive growth, today’s competitive environment is forcing institutions to rethink how aggressively they invest in marketing and brand development.
Consumers also have more financial choices than ever before. Large banks continue pouring money into digital acquisition, while fintech firms keep raising expectations around speed, personalization and user experience. Many credit unions are also managing slower industry asset growth, rising operating costs, and increased pressure to retain and deepen member relationships.
To better understand how the industry is responding, Capital Performance Group (CPG), in partnership with The Financial Brand, analyzed 2025 NCUA call report data to benchmark marketing investment trends across the credit union industry. The analysis examines how marketing budgets differ by asset size, how spending changed from 2024 to 2025, and how marketing investment aligns with broader financial performance metrics.
Key insight: The findings showcase a widening strategic divide.
• Larger credit unions are investing substantially more in marketing relative to their operating budgets and are increasing spend at a much faster pace than smaller ones.
• Larger institutions also reported stronger deposit growth, loan growth and revenue performance, reinforcing marketing’s growing role as a core growth function rather than a discretionary expense.
Read a two-part companion report about banks’ marketing spending.
Need to Know:
- Marketing investment accelerated across the credit union industry in 2025, with mid-sized and large credit unions increasing budgets by roughly 9% year-over-year.
- Larger credit unions dedicate significantly more of their operating budgets to marketing — institutions above $5 billion in assets spend more than three times as much relative to noninterest expense as credit unions under $100 million.
- Credit unions with higher marketing investment tended to report stronger deposit growth, loan growth and revenue expansion in 2025.
- Despite the rebound in spending, marketing still accounts for a surprisingly small share of operating expense at most credit unions, but its strategic importance continues to rise as competition from banks and fintechs intensifies.
Methodology for Analyzing Marketing Spend’s Impact
This analysis is based on 2025 yearend National Credit Union Administration call report data for federally insured credit unions, with year-over-year comparisons to 2024 and 2023 where noted. Institutions are segmented into four asset-size tiers: under $100 million, $100 million to $499.9 million, $500 million to $4.9 billion and $5 billion and above.
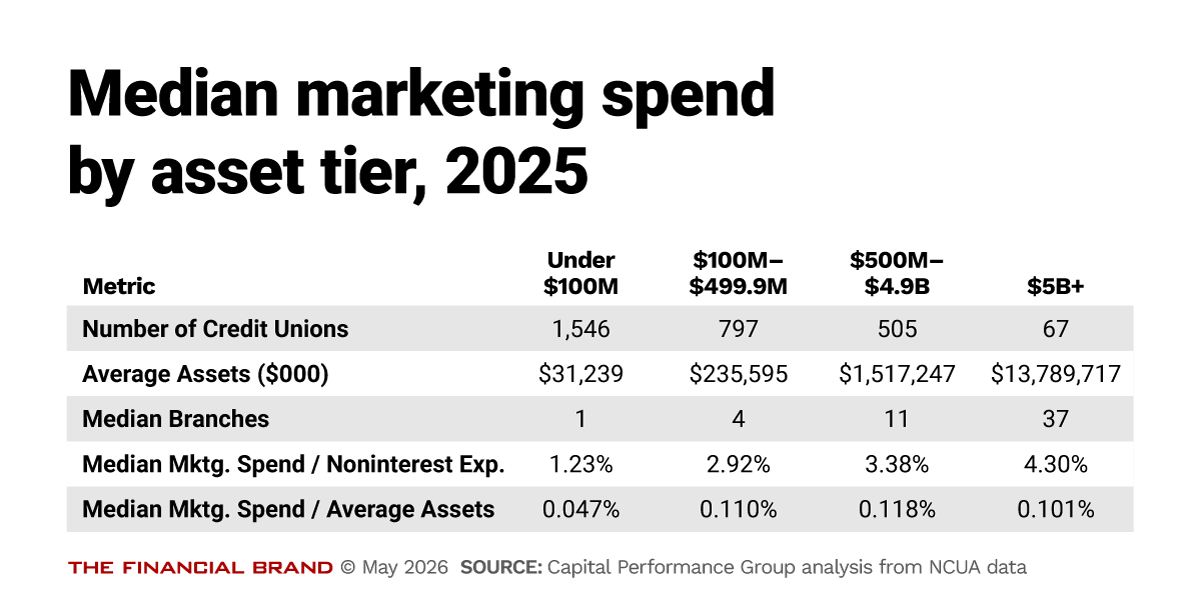
Marketing expense is reported as a line item in NCUA call reports as “education and promotional expense, defined as costs associated with advertising, publicity and promotions.” Unless otherwise noted, all figures shown are medians to reduce distortion from unusually high or low values. The sample includes 2,915 credit unions with reporting data, spanning 1,546 institutions under $100 million, 797 in the $100 million–$499.9 million tier, 505 in the $500 million–$4.9 billion tier and 67 above $5 billion.
The Size of Credit Union Marketing Budgets in 2025
Marketing investment at credit unions scales sharply with asset size. The gap between the smallest and largest institutions is more than size and scale. It reflects a different approach to growth and member acquisition.
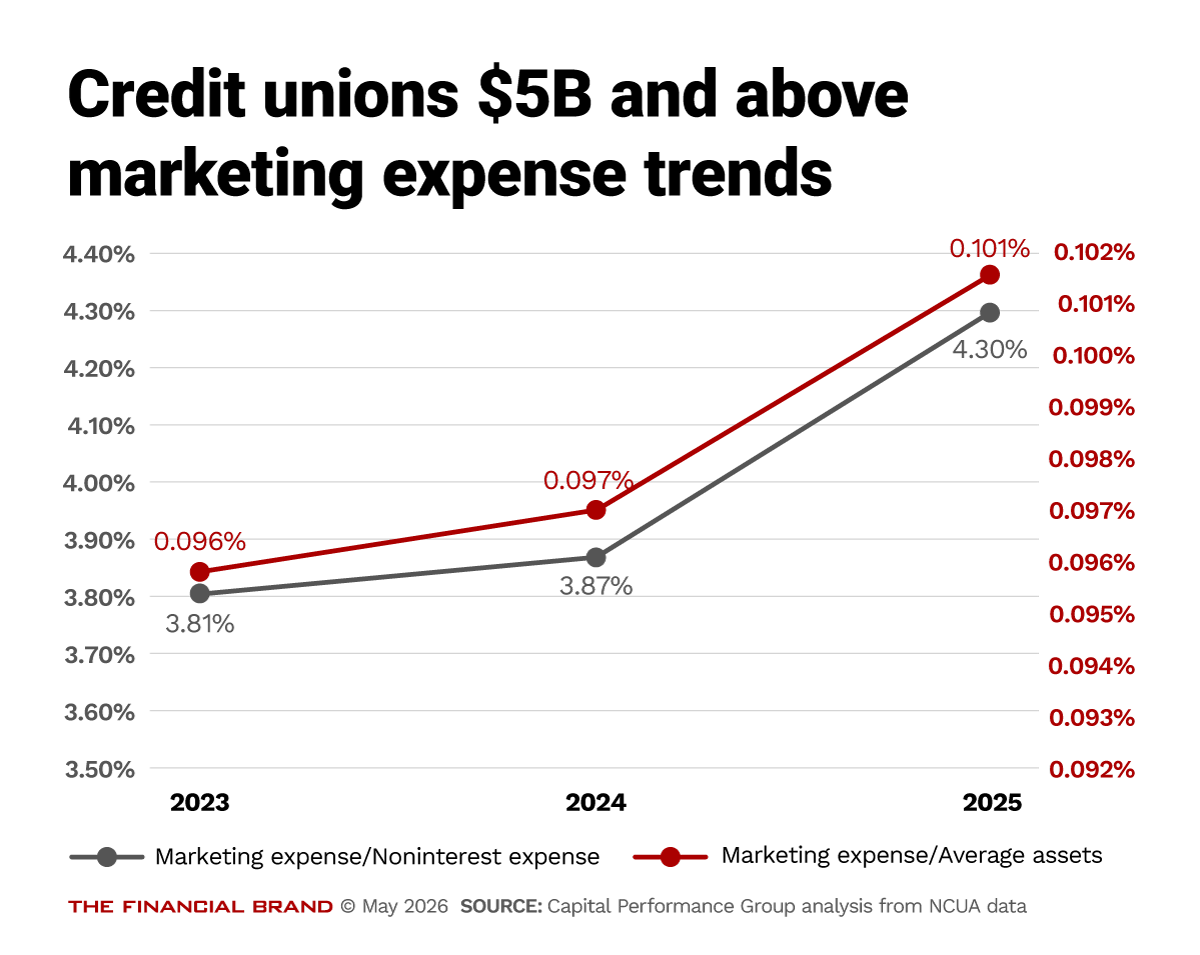
Among credit unions under $100 million in assets, the median marketing spend as a percentage of noninterest expense was 1.23% in 2025. That figure rises to 2.92% for institutions in the $100M–$499.9M range, 3.38% for those between $500 million and $4.9 billion and 4.30% for credit unions above $5 billion.
Put differently, the largest credit unions dedicate more than three times as much of their operating budget to marketing as their smallest counterparts.
A similar pattern holds when marketing spend is measured as a percentage of average assets. Small credit unions spend roughly 0.047% of average assets on marketing. Mid-tier institutions ($100M–$499.9M) spend 0.110% and those in the $500M–$4.9B range spend 0.118%. Notably, the largest credit unions spend slightly less on a relative-to-assets basis (0.101%) than the two middle tiers — likely reflecting economies of scale in brand-building and the ability to amortize fixed marketing investments across a larger asset base.
Read more: How Golden 1’s CMO Is Adopting AI Without Compromising Authenticity
Credit Union Marketing Budgets Rebounded in 2025
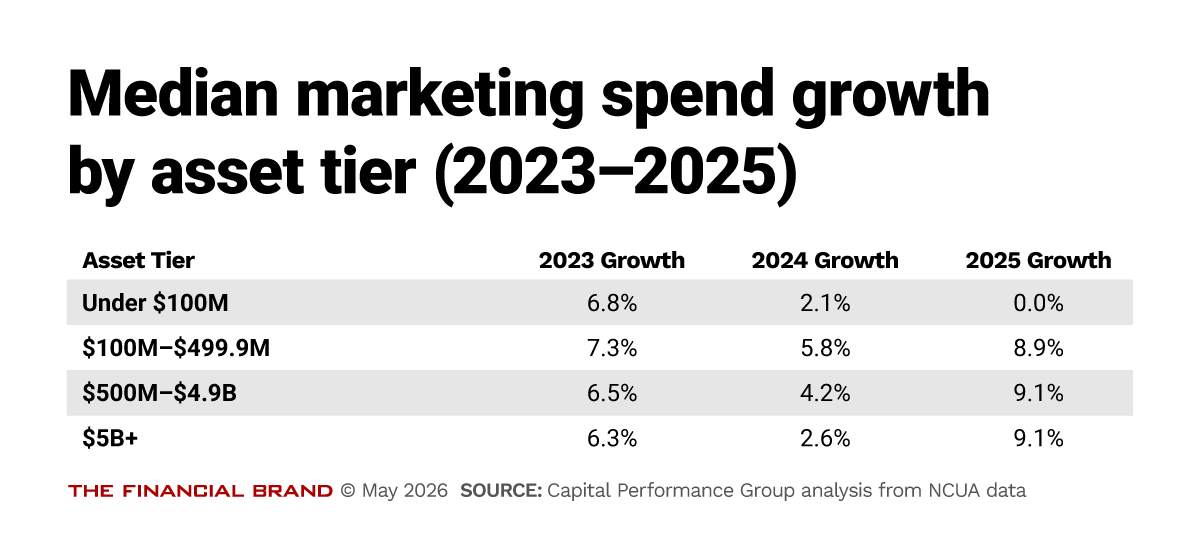
After several years of modest growth, marketing budgets accelerated meaningfully in 2025. Mid-sized and large credit unions increased marketing spend by approximately 9% year-over-year — a notable step-up from the low single-digit growth rates that characterized the prior two years.
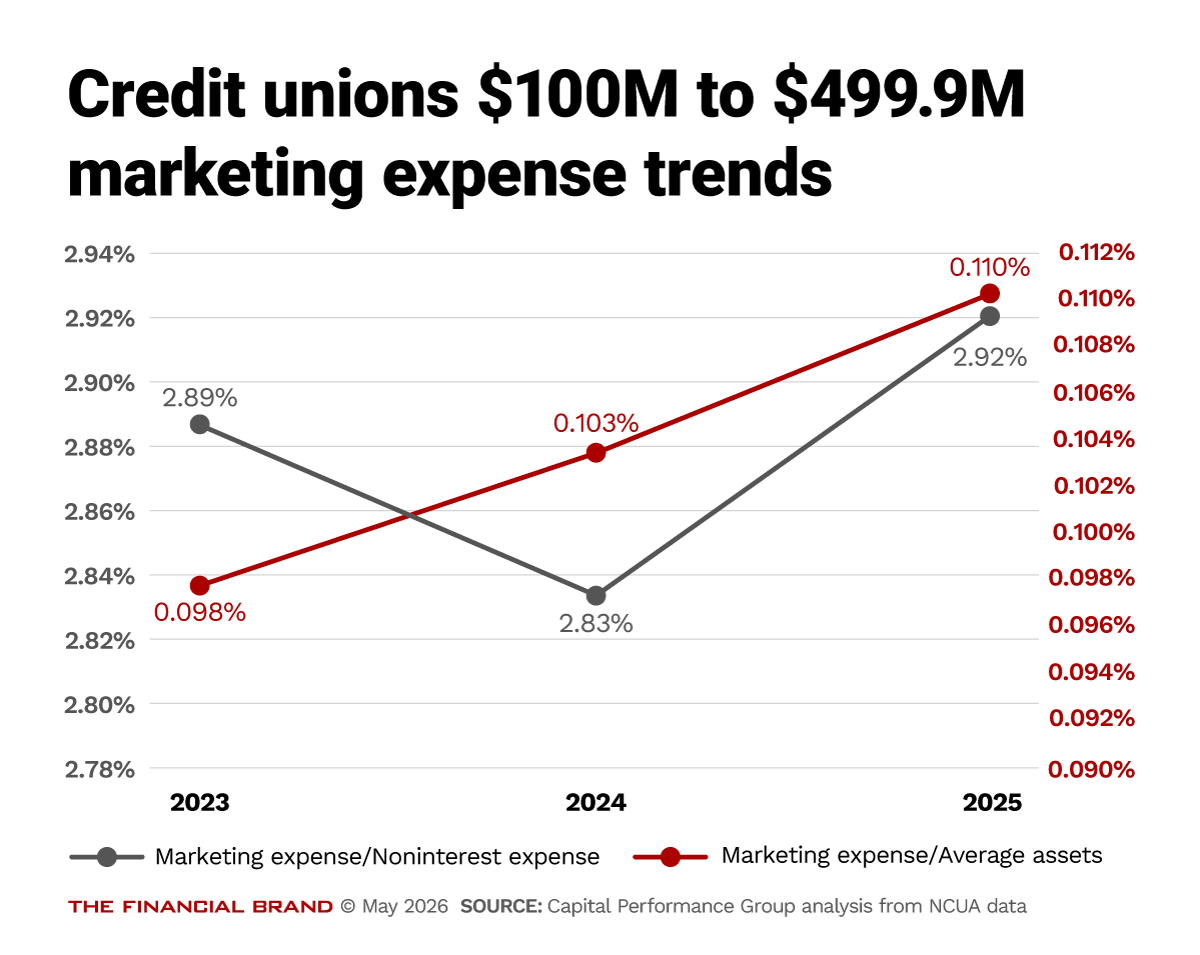
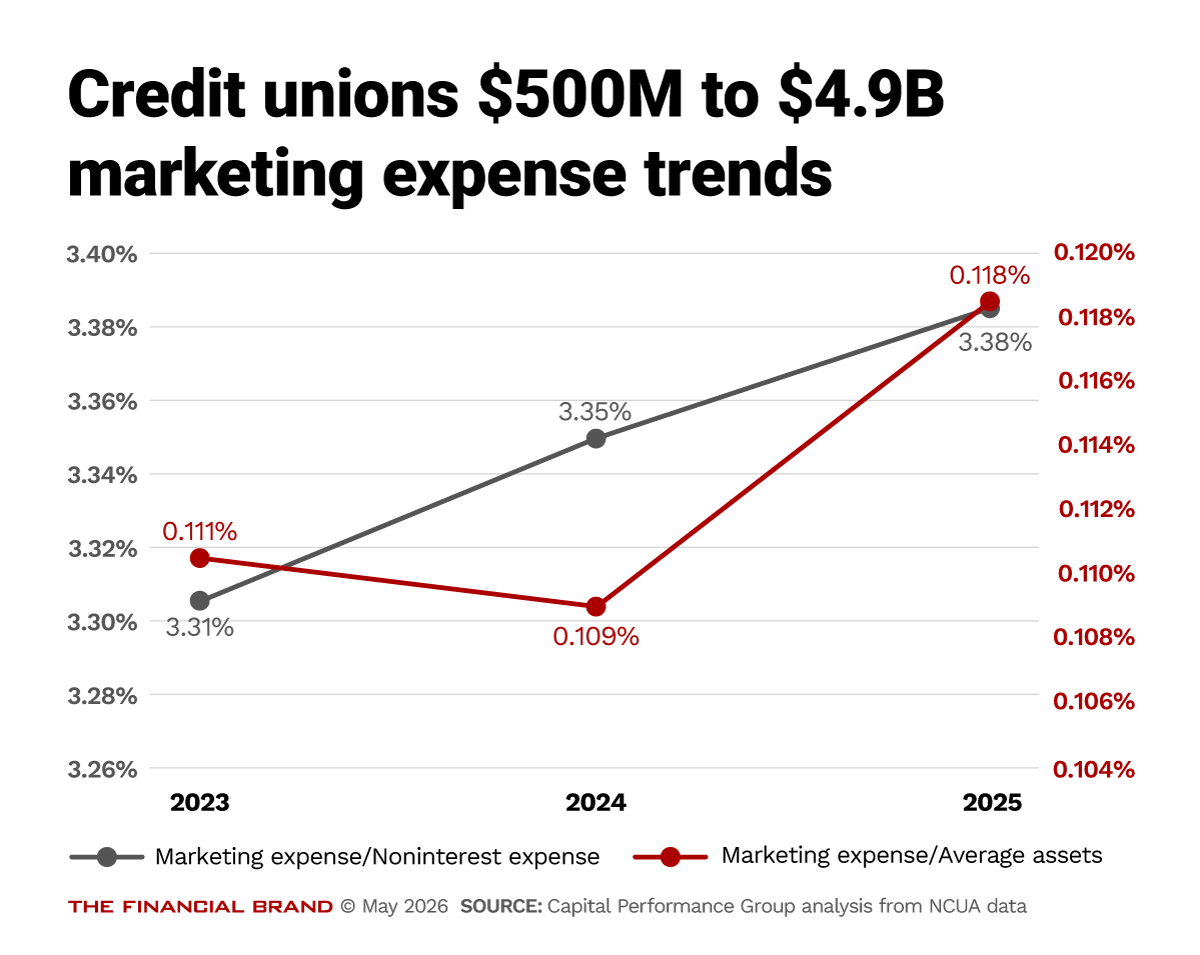
Among credit unions in the $100 million–$499.9 million range, median marketing spend growth was 8.9% in 2025, compared to 5.8% in 2024 and 7.3% in 2023. Credit unions between $500 million and $4.9 billion grew budgets by 9.1% in 2025 versus 4.2% in 2024. The largest institutions — those above $5 billion — posted the strongest growth at 9.1%, up from 2.6% in 2024.
The contrast with the smallest tier is stark.
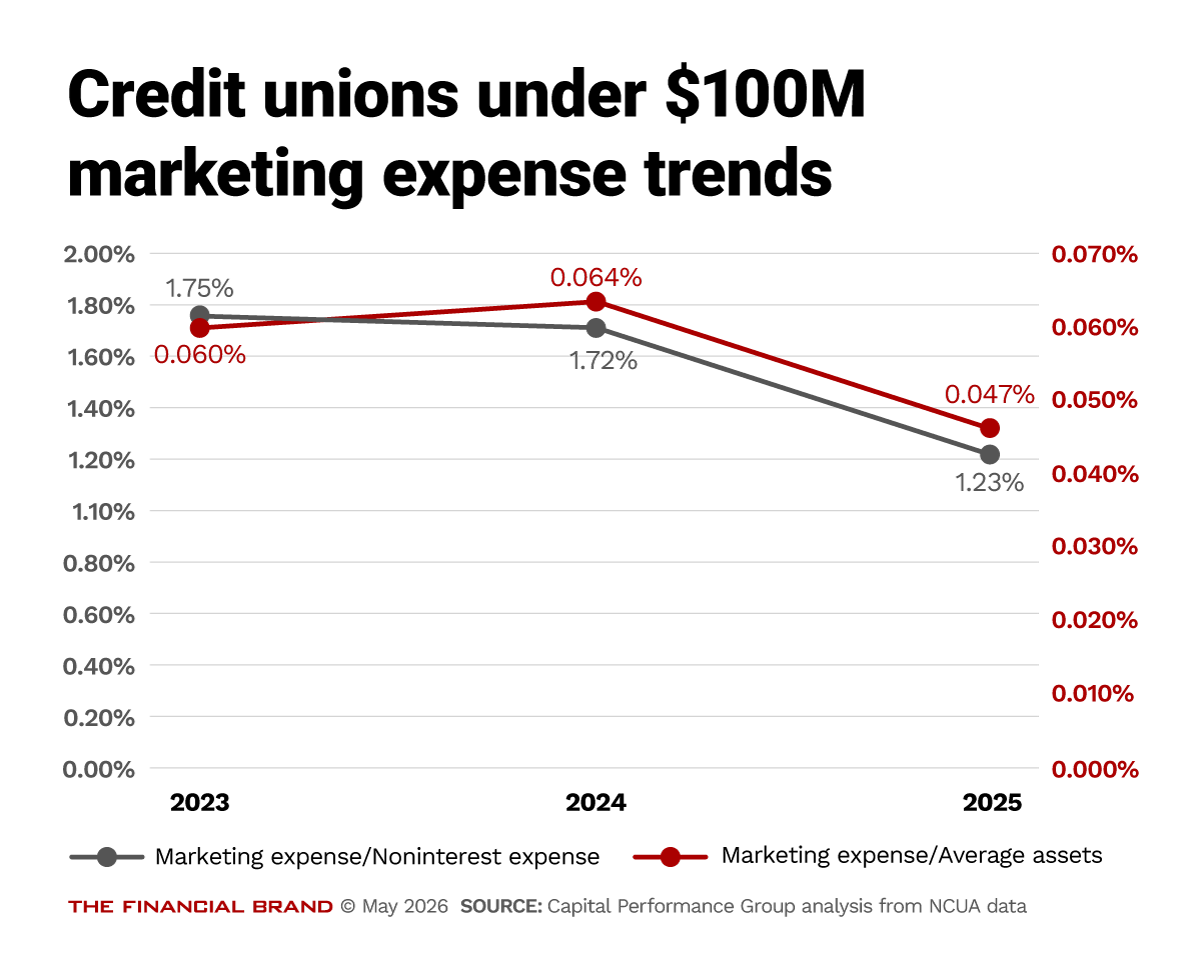
Credit unions under $100 million reported zero median marketing spend growth in 2025, having eked out just 2.1% growth in 2024. For this segment, marketing budgets are constrained by operating leverage challenges and limited staff resources, making meaningful budget expansion difficult even when competitive pressure demands it.
The acceleration in 2025 spending reflects several converging forces:
• Credit unions spent most of 2025 fighting for deposits in an intense, rate-sensitive environment.
• Digital member acquisition channels also became more expensive as more institutions competed for the same audiences online, pushing up the cost of paid media and performance marketing.
• Fintech firms and large banks maintained substantial brand investment, raising the visibility threshold that credit unions must clear to stay relevant for members.
Read more: Affordability Is Driving Consumers to Auto Loan Refis — and Opening a Growth Route for Lenders
Marketing Investment and Financial Performance
One of the more significant findings from this analysis is the relationship between marketing investment and financial outcomes.
Across deposit growth, loan growth and revenue expansion, larger institutions outperformed smaller peers in 2025.
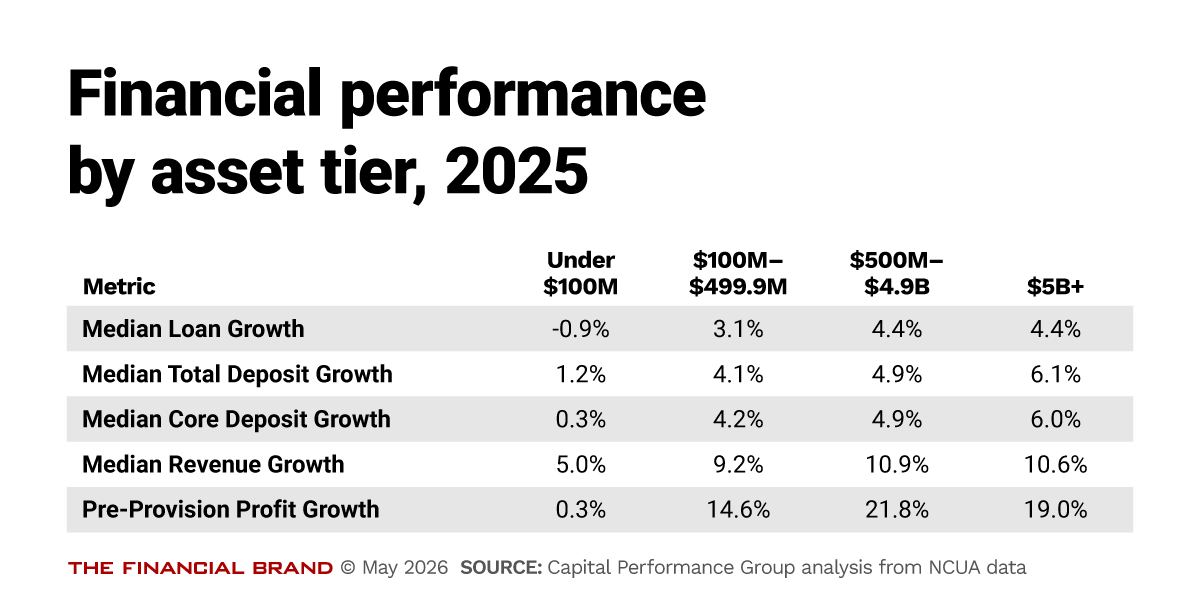
Credit unions above $5 billion — the highest-spending tier — reported median total deposit growth of 6.1% in 2025. Institutions in the $500M–$4.9B range grew deposits by 4.9%. The $100 million –$499.9 million tier posted 4.1% deposit growth. By contrast, credit unions under $100 million — the same segment where marketing spend was flat — grew deposits by just 1.2%.
The loan growth data tells a similar story. Credit unions under $100 million saw median loan balances decline by 0.9% in 2025. Mid-tier and large institutions grew loans from 3% to 4.4%, consistent with their more active marketing footprint and greater capacity to attract and convert potential borrowers through digital and traditional channels.
Revenue growth follows the same gradient. Institutions above $500 million in assets grew revenue by approximately 10.6% to 10.9%, compared to 9.2% for the $100 million–$499.9 million tier and just 5.0% for the smallest institutions.
Pre-provision operating profit growth shows perhaps the sharpest divergence: the median $500 million–$4.9 billion credit unions grew operating profit by 21.8%, while the median institution under $100 million grew by just 0.3%.
Read more: Bricks Create Clicks: Branches and Digital Should Work Together
The Efficiency of Credit Unions’ Marketing Spend
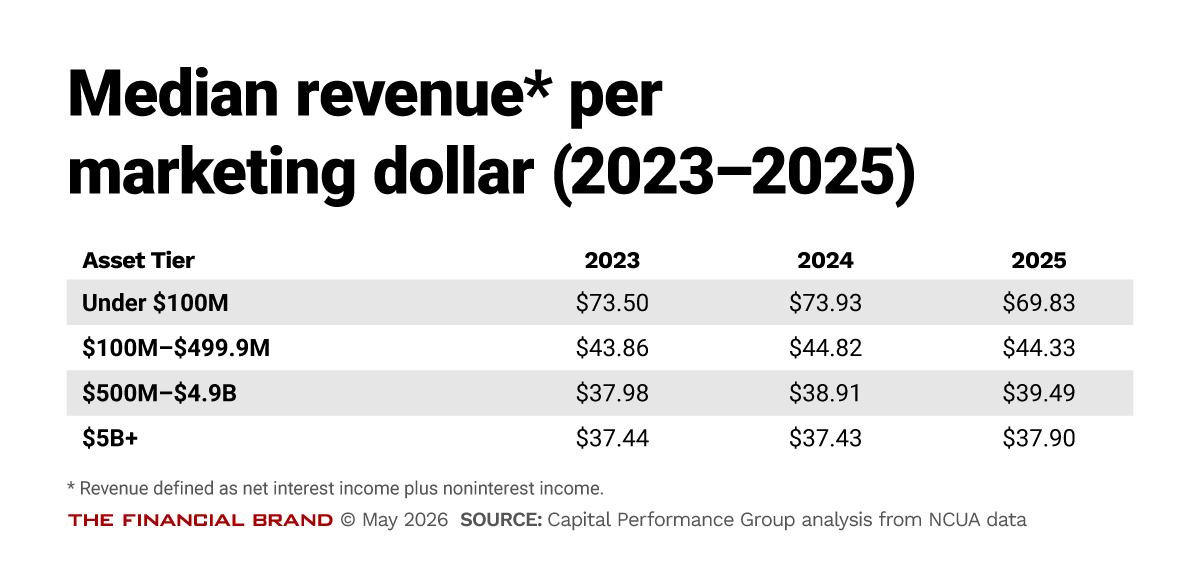
Beyond the volume of marketing investment, the productivity of that spending matters. One useful proxy is the ratio of revenue generated per dollar of marketing expense — a measure that captures how effectively marketing dollars are converted into financial results.
The data reveals a pattern that looks counterintuitive initially: smaller credit unions generate more revenue per marketing dollar spent than their larger peers. The median credit union under $100 million generates $69.83 in revenue per dollar of marketing spend. That figure falls to $44.33 for the $100 million–$499.9 million tier, $39.49 for the $500 million–$4.9 billion tier and $37.90 for the largest institutions.
This inverse relationship reflects the different nature of marketing at different scales.
• Small credit unions rely heavily on community relationships, word-of-mouth and low-cost brand reinforcement in tight-knit geographies. Their marketing dollars, while fewer, operate in contexts where familiarity and trust are pre-built.
• Large credit unions must build and sustain awareness across broader and more competitive markets. They invest in brand-building activities — sponsorships, digital campaigns, media buys — whose payoffs are long-term and diffuse rather than immediately measurable.
Read more: This California CU Grew by Serving the Movie Market. Now It’s Taking Its Show on the Road
Marketing’s Rising Strategic Role in Credit Unions
The conclusions from this analysis reinforce a broader shift that has been building in the credit union industry for several years: Marketing is increasingly being evaluated not as a branding or communications function, but as a driver of revenue generation, member acquisition and long-term franchise value.
The institutions posting the strongest growth in 2025 were not those with the lowest cost structures nor the highest net interest margins — they were the ones investing most actively in creating awareness, communicating value and reaching prospective members where they make financial decisions. As deposit competition persists and digital acquisition costs continue to rise, the institutions that have built capable marketing functions will be better positioned to sustain growth through the next cycle.
A few important caveats are worth noting:
• Asset size and marketing spending are correlated with many other institutional characteristics like leadership philosophy, market geography, member demographics and product mix.
• The performance differences observed across tiers are not solely attributable to marketing investment.
• Correlation does not establish causation and institutions should be thoughtful about how they benchmark against peers with different structural contexts.
For credit union executives and boards assessing their own marketing investment, the relevant question is not whether to spend more, but whether current spend levels are adequate to compete for the members and the growth that the institution needs to fulfill its mission over the next decade.
Read a two-part companion report about banks’ marketing spending.


