Personalization and Accessibility: Are Banking Apps Doing Enough?
For those with accessibility needs, customization can be the difference between financial independence and having to rely on others to do even minor tasks.
By Alexandros Argyriou, CEO of FinTech Insights
Simple Subscribe
Subscribe Now!
The discourse around personalization in banking often centers around product features.
But while tailoring accounts, loans, and other products to individuals’ lifestyles is undoubtedly important — according to MX, 48% would happily give banks more data in exchange for more personalized service — enabling customers to do this to the interface itself matters, too.
For one, putting the individual in charge of the way their banking app looks and feels improves the user experience, boosting loyalty, trust, and engagement.
More to the point, for those with accessibility needs, customization can be the difference between financial independence and having to rely on others to do even minor tasks like checking their balance.
So how are banks faring in this often overlooked but significant component of the digital banking experience?
Here’s what the data from FinTech Insights tells us.
A Note on the Data
For our deep dive into customization and accessibility, we’ve looked at 211 banking apps: 87 in the U.S., 53 in the EU, 18 in the UK, 16 in Canada, 24 in Latin America, 4 in Turkey, and 9 in Asia Pacific.
In total, we examined eight customization functionalities and three accessibility functionalities.
The customization functionalities are:
- Choose a custom app icon design from a predefined selection
- Choose your card’s design from a selection of templates, or create your own
- Decide where specific elements are displayed on the home page and other pages
- Add / Manage bookmarks. This feature enables the user to add and place dashboard items in order of preference or frequency of use
- Change font size
- Change the interface color scheme
- Choose app language
- Add widgets to your banking app’s home page
The accessibility features are:
- App customizations such as high contrast, color adjustments, and screen readers
- Inclusive support content — primarily audio and video materials
- Physical statement type, mainly larger font size and braille
Shockingly, these three were the only accessibility features available in the markets we included in our sample.
Speak My Language
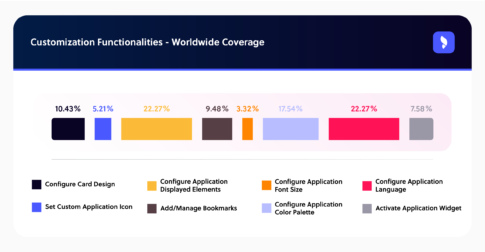
From a customization perspective, the most widely available functionalities overall, each offered by 22.27% of our sample, are language and displayed elements. The least common is the ability to change font size, available from only 3.32%.
Language options are far more common in Turkey, the EU, and Asia Pacific — 50%, 49.06%, and 44.44% respectively, compared to 13.79%, 12.5%, 4.17%, and 0% in the US, Canada, Latin America, and the UK.
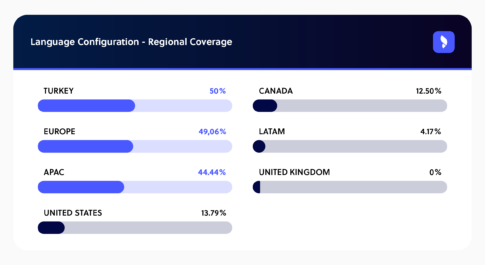
The former three regions, and especially Asia Pacific, where people speak over 3,000 different languages, are extremely linguistically diverse, which might explain why the feature is so popular.
But Latin America, the U.S., Canada, and, to a lesser extent, the UK, are linguistically diverse too, so we’d have expected a higher percentage of firms in these markets to offer language options, too.
Learn more:
- Can Banks Fix Our Stubborn CX Shortfall Versus Customer Expectations?
- Balancing Technology with Personal Touch: The Evolution of Digital Lending
- How to Use AI to Remove Financial Friction for Persons with Disabilities
It’s Got The Look
Looking at customization more broadly, the U.S., the EU, and Canada are the only three regions where all eight functionalities are offered by at least one bank, while Asia Pacific is the weakest, with only two functionalities — language and color scheme — available.
That said, a more detailed look at the numbers shows that the U.S. and Canada are still weak overall. In the U.S., the most widely available feature — color scheme — is only offered by 17.24%, while, in Canada, the two most widely available features, card design and language, are offered by only 12.5%.
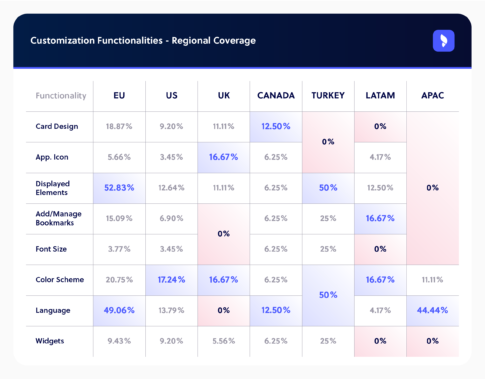
While the EU is strong on display elements — at 52.83%, more EU banks offer this functionality than any other region — and language choice, it’s relatively weak on other features.
Card design is more widely available in the EU than any other region, for instance, but the proportion of EU banks that offer it — 18.87% — is still quite low. EU banking apps are also at the bottom of the pile for font size (3.77%), and next to last for custom app icons (5.66%).
How Accessible are Digital Banking Apps?
Where, from a customization perspective, it’s a case of “they’re at least doing something, but they could do much better,” banks have barely scratched the surface when it comes to accessibility.
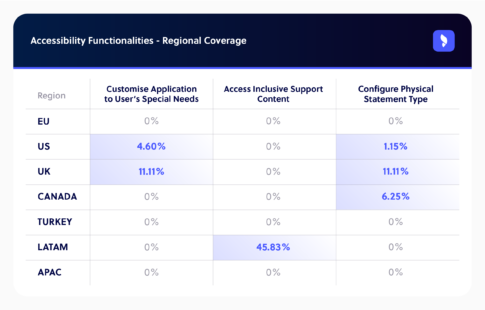
In the EU, Turkey, and Asia Pacific, no banking app offers any of the accessibility functionalities we looked at. Since, as we mentioned above, these were the only three accessibility features available in the markets we evaluated, this effectively means that no bank in the EU, Turkey, or Asia Pacific has incorporated users’ accessibility needs into their app design.
In Canada, 6.25% enable consumers to configure their physical statement type. And, in Latin America, 45.83% provide support content in audio and video.
U.S. and UK banking apps are the most accessible. As in, they’re the only two regions where more than one of the three accessibility features are available.
This doesn’t make the numbers any less disheartening.
In the UK, 11.11% — 2 banks — enable users to access tailored support. The two banks in question, Virgin Money and NatWest, enable users to explain their specific access needs, for example being spoken to slowly or being sent everything in writing.
This is the most thorough accessibility feature in our sample, because it enables users to get tailor-made support. Given that implementing it is relatively simple — users fill out a form within the app — it’s surprising that it isn’t more widely available.
A further two UK banks — Barclays and Lloyds — allow statements to be sent to users in braille form.
In the U.S., a mere 4.6% — 4 out of 87 banking apps — offer tailored support.
Most of the features are limited to improving access for the visually impaired. Community Choice Credit Union and UFirst Credit Union have a high contrast mode, which allows users to darken some colors to improve readability. MoneyLion has a screen reader, while Robinhood enables color-blind users to make adjustments to the interface’s color scheme.
Only one U.S. bank — aptly, the bank is U.S. Bank — enables users to configure their physical statement. And, again, only a sub-segment of visually impaired consumers are served, as the available feature is large print.
Customization is a Necessity, Not a Luxury
While incorporating visual customization like a choice of app icons might seem frivolous, the reality is that they have a tangible impact.
According to a Deloitte report, a growing number of consumers across all age groups want to have a say in how a product looks and feels. More significantly, one in five are willing to pay up to 20% more to be able to do this, and 48% would wait longer for the product, which strongly suggests that customization increases brand loyalty.
More importantly, though, customization is also about making digital banking more accessible.
About 15% to 16% of the world’s population live with some form of disability, according to the World Health Organization. That’s 15% to 16% of humanity whose ability to take care of their financial affairs is being made unnecessarily difficult — or who are being excluded — when reasonable adjustments would improve their user experience, strengthening their relationship with their bank.
But accessibility isn’t just about reaching more customers. It’s about making the digital banking experience the best it can be.
Ultimately, the greater the number of consumers who can easily navigate digital banking apps, regardless of their abilities, the better the user experience is for everyone. And, in an increasingly digital world, that matters more than ever.