Why Deposit Profitability, Not Deposit Volume, Should Be Your Goal
By Steve Reider, president and founder, Bancography
Simple Subscribe
Subscribe Now!
Executive Summary
- Financial institutions tend to compare their branches to competitors’ on the basis of raw deposit totals. But that’s not the best measure of success.
- Using the Philadelphia market as a proxy, analysis shows that the revenue on deposits varies significantly from one bank to another.
- Volume alone doesn’t win the branch battle. Smaller players that find lower-cost funds can win on the basis of returns.
About 10 years ago, my firm was working on a branch-expansion project with a large regional bank.
We were sharing with our primary project contact that the top-ranking opportunities showed five-year deposit projections in the $40 million to $50 million range. Our contact lamented that when he communicated these projections to his manager, the manager — a former executive at extravagant rate payer at (defunct) Countrywide Financial — deemed that level unacceptable.
He said that his boss would rant: “When I was at Countrywide, we could get a branch to $90 million in two or three years!”
That would lead our contact to mutter to us (confidentially, of course), “Yeah, I could build a $90 million branch out of my kitchen — if I paid what they paid for CDs!”
Countrywide rose to prominence during the early 2000s as a mortgage issuer that funded those mortgages through a thrift charter, using a model of paying up for CDs through non-branch channels, versus a more traditional branch-based model driven by retail and small-business deposits.
During the financial crisis of 2008 – 2009, Countrywide spectacularly imploded, joining other such notable failed or near-failed institutions as Bear Stearns, Washington Mutual and Lehman Brothers as symbols of the era.
Banking history lessons aside, the point is that it’s easy to gain deposits if you’re willing to pay any price — but gathering deposits in a more disciplined, fiscally responsible matter is challenging.
Thus, when evaluating the competitive environment in a market, comparing average deposits per branch does not necessarily convey the relative efficiency of one branch network versus another.
If Bank A holds $500 million in deposits in 10 branches and Bank B $300 million in deposits in four branches, then the average deposits — $75 million per branch for Bank B versus $50 million for Bank A — would seem to indicate Bank A is more efficient.
But is that really the last word?
Read more: Deposit Momentum is Back. Future Growth Requires Careful Nurturing
Raising Deposits: Effective Versus Cost-Effective
We can learn more about which competitors are truly most efficient by folding in a measure of cost of funds, to see not only how effective each network is at raising funds, but how cost effective the network is.
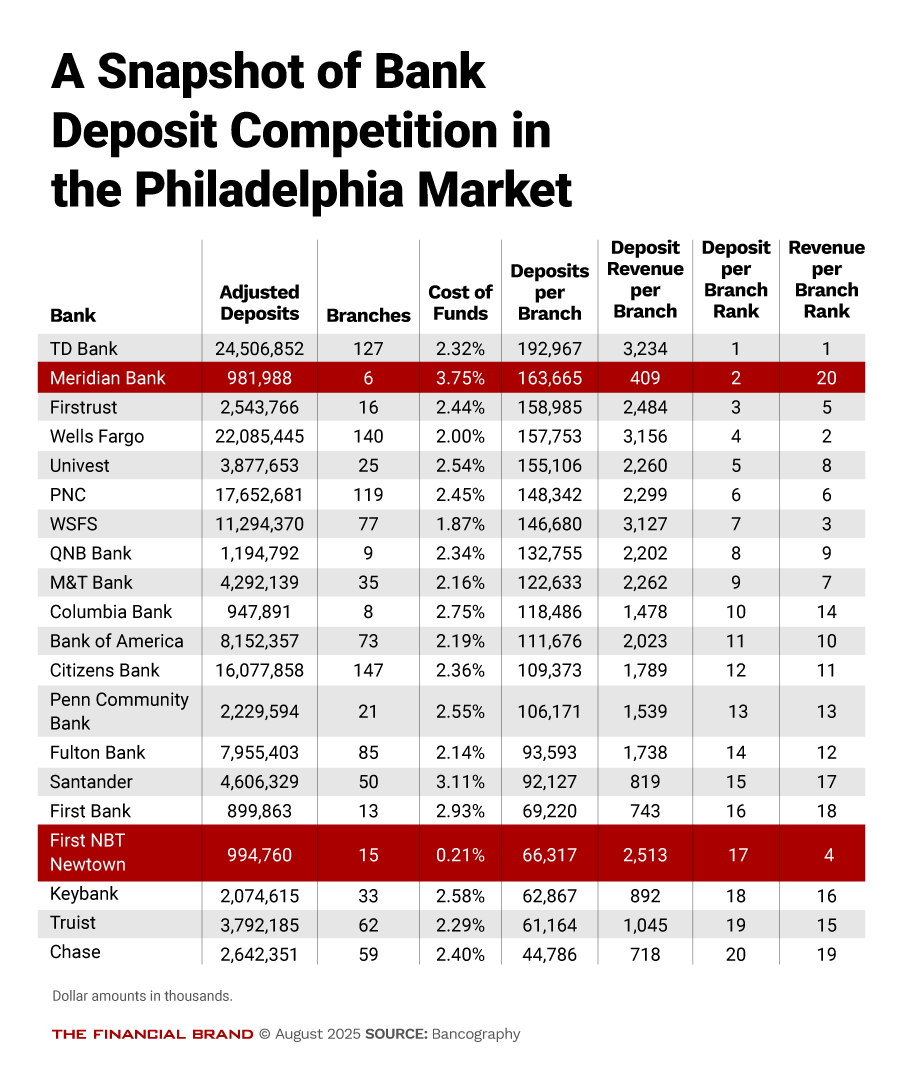
Consider the example below, showing the top-20 deposit-holding banks in the Philadelphia metropolitan statistical area. (The list includes banks only, because credit unions are not required to report deposits at the branch level).
If we restrict corporate and municipal deposits by capping any individual branch deposits at $250 million (i.e., assuming balances beyond that level are neither retail nor small business), we can then rank the 20 banks by adjusted deposits per branch, for a rudimentary look at branch-network efficiency.
But that first pass examines only the deposit volumes — not the cost of those funds.
To extend the analysis, we next layer in each bank’s overall cost of funds. And then, we assume a 400 basis point valuation of those deposits under a spread-to-pooled rate model. (This is a pooled treasury rate that apportions the bank’s revenue between the deposit and loan sides, versus applying all revenue to the loan side. See our methodology here.) We can then estimate the deposit revenue per branch the bank’s network is generating, and not only the deposit balance per branch.
Most banks in the table carry a similar cost of funds, and so the rankings in deposits per branch and deposit-revenue per branch remain mostly consistent.
However, two banks stand out. Meridian Bank shows presumably an effective network with $163 million in deposits per branch, the second-highest level in the metro. But the bank’s cost of funds is 375 basis points, so the margin on those deposits is limited, such that the bank shows the lowest deposit-revenue per branch among the market leaders — a network of large, but not cost-effective branches.
Contrast that with The First National Bank & Trust Company of Newtown, which uses the shorthand name of The First.
The bank has average deposits of only $66 million per branch, ranking 17th among the top-20 banks on that measure. But because the bank raises funds at a startlingly low 21 basis points, it ranks fourth in deposit-revenue per branch. This indicates a network of smaller-balance but highly cost-effective branches.
The First’s tremendously low funding costs allow its branches to generate revenue value on par with the region’s largest branches, but from much smaller deposit levels — an exemplar of efficiency.
The mathematics above assume that each bank’s cost of funds applies uniformly across its network, and that the banks all value deposits at the same pooled-treasury-rate level. These are assumptions, and there will be variance to the actual values.
But the results should still provide valuable context, in general terms, for the respective banks in any given market.
Read more:
How Some Davids Can Outbank Some Goliaths
So, kudos to the management and staff of The First, for proving community banks can raise funds as cost effectively, or in this case more effectively, than some of the largest banks in the nation. In doing so, they generate top-tier per-branch revenues, even if on lesser per-branch deposit bases.
There are plenty of other examples of community banks leveraging low funding costs to generate top-tier per-branch revenues, albeit few with funding costs as low as The First.
Other examples include: The Bank of Tampa in its namesake market, Bank of Marin in the San Francisco market, Farmers and Merchants Bank in the Charlotte market, and Watertown Savings in the Boston market. All have per-branch revenue capacity above what their deposit levels might indicate, due to favorable cost-of-funds levels.
In sum, concerted attention to deposit mix and pricing can more than offset lesser absolute deposit levels, and community banks can be just as effective as larger national banks in achieving lower funding costs.
Further, when assessing the competitive environment of any given market, it is essential to examine not only the size of the competing branches therein, but also how the respective banks achieved those levels — whether via buying deposits with sky-high rates (going back to the Countrywide story), or from a more arduous and disciplined effort to accrue low-cost funds.
This article originally appeared in Bancography’s quarterly newsletter, Bancology.
Read more: Banks Lost $3 Trillion to Fintechs in the Last Five Years. Blame the Primacy Myth