
New Campaign Data Reveals FI Marketers May Have It Backwards
By Alisha Crafton, Chief Content Officer at Marquis
Simple Subscribe
Subscribe Now!
Here is what a Marquis analysis of nearly 3,000 client marketing campaigns run for community banks and credit unions last year actually show: the programs receiving the most budget consistently post the lowest response rates, and the programs receiving the least budget consistently post the highest.
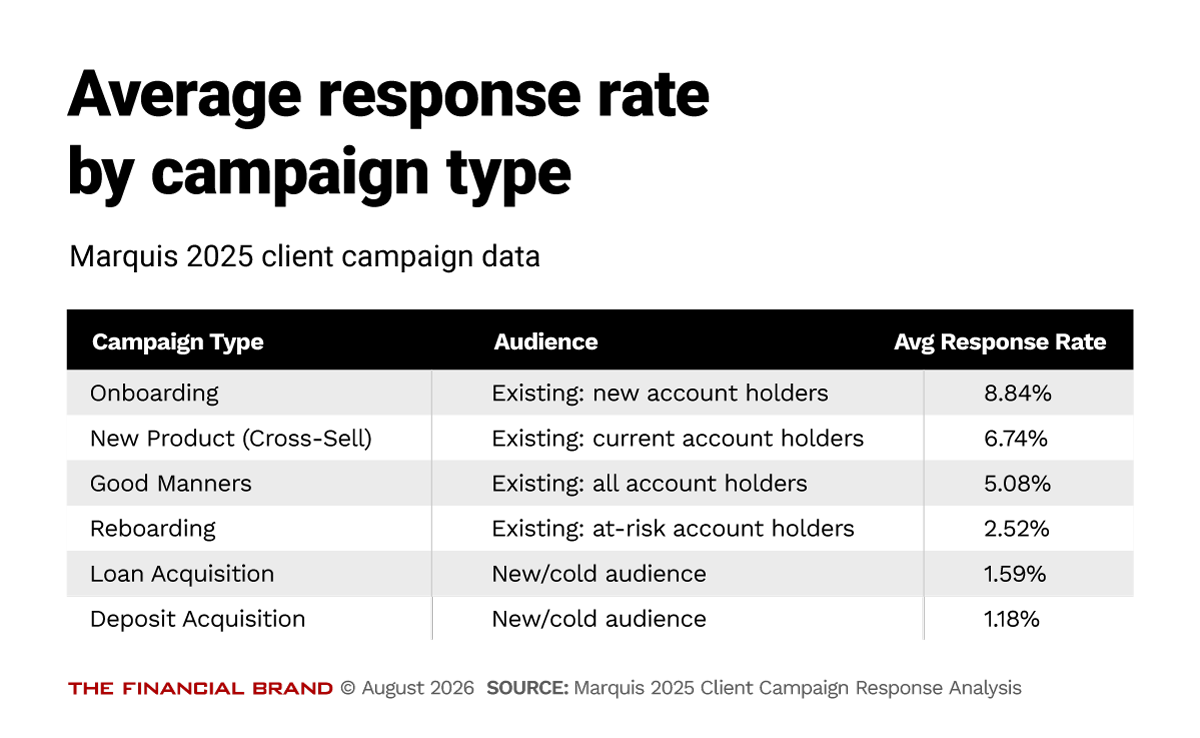
Across 2,989 campaigns spanning 90 institutions and nearly two million account holder touchpoints, the pattern is consistent. The campaigns producing the highest response rates are the ones reaching people the institution already knows. The campaigns with the lowest response rates are the ones targeting cold audiences.
The three top performers — onboarding at 8.84%, new product cross-sell at 6.74%, and Good Manners outreach at 5.08% — all target existing account holders. The two lowest — loan acquisition at 1.59% and deposit acquisition at 1.18% — target new or cold audiences. Onboarding outperforms deposit acquisition by a factor of more than seven. Yet the ABA’s 2026 bank marketer survey shows new customer acquisition still ranked as the top marketing objective for the year, with retention a distant second. The priority order is the inverse of the return order.
Part of the reason acquisition budgets persist is visibility — new account growth is easy to present to a board. The economics of retention are harder to isolate on a report, but they are not ambiguous. Acquiring a new customer costs five to twenty-five times more than retaining one, and acquisition costs have risen sixty percent over five years. The highest-return budget shift most community institutions can make right now is moving dollars from cold prospecting into lifecycle programs for people already in their book.
The campaigns producing the highest response rates are overwhelmingly the ones targeting people the institution already knows.
The Timing Advantage That Automation Creates
The second pattern is simpler than most institutions would like to admit: when a campaign lands matters as much as what it says.
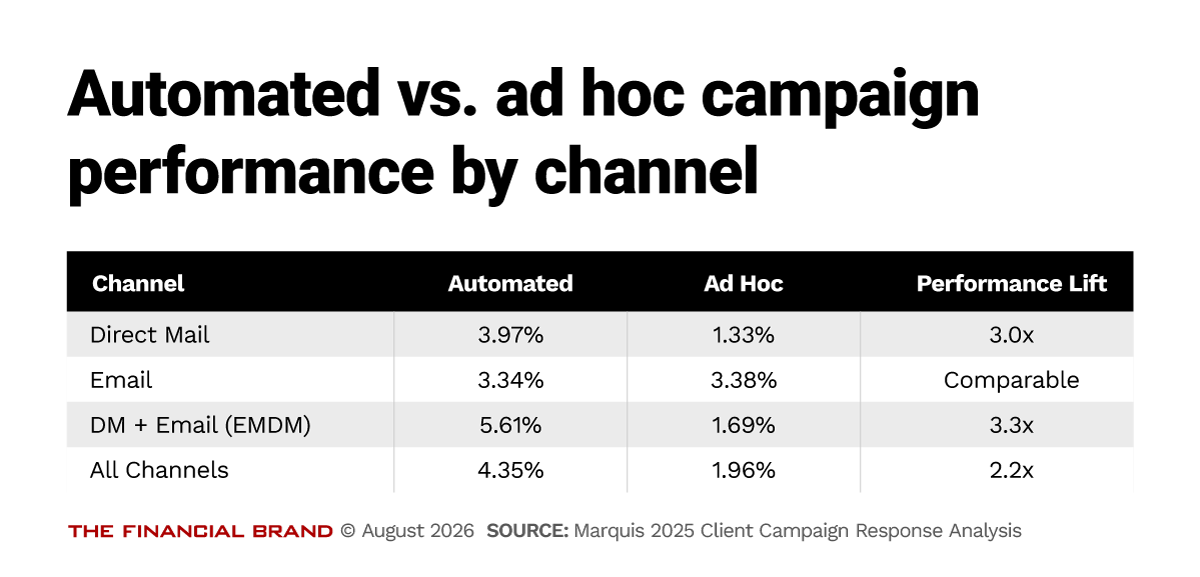
Automated campaigns, triggered by actual account holder behavior such as a new account opening, a product milestone, a payoff event, or a shift in transaction activity, averaged a 4.35% response rate. Ad hoc campaigns, built on a quarterly or monthly calendar, averaged 1.96%. That 2.2x gap holds across every channel analyzed.
Add omnichannel delivery to automation and the advantage grows. Automated campaigns using both direct mail and email averaged 5.61%. The same dual-channel format run on an ad hoc schedule averaged 1.69% — a 3.3x difference from a single structural decision about when the campaign deploys.
Research shows that response rates drop 30 to 40 percent each week after a triggering behavior. The institution that responds within 24 hours is competing for an open decision. The one that waits two weeks is competing for a decision that has already been made — and almost certainly answered by someone else.
Community institutions hold an advantage no digital-first competitor can replicate: existing relationships, transaction history, and in many cases a direct human connection. That advantage is real. Automation is what converts it at the right moment.
The Omnichannel Performance Gap
The third finding may be the most immediately actionable: adding a second channel to a campaign that is already performing produces a larger lift than most channel budget conversations would suggest.
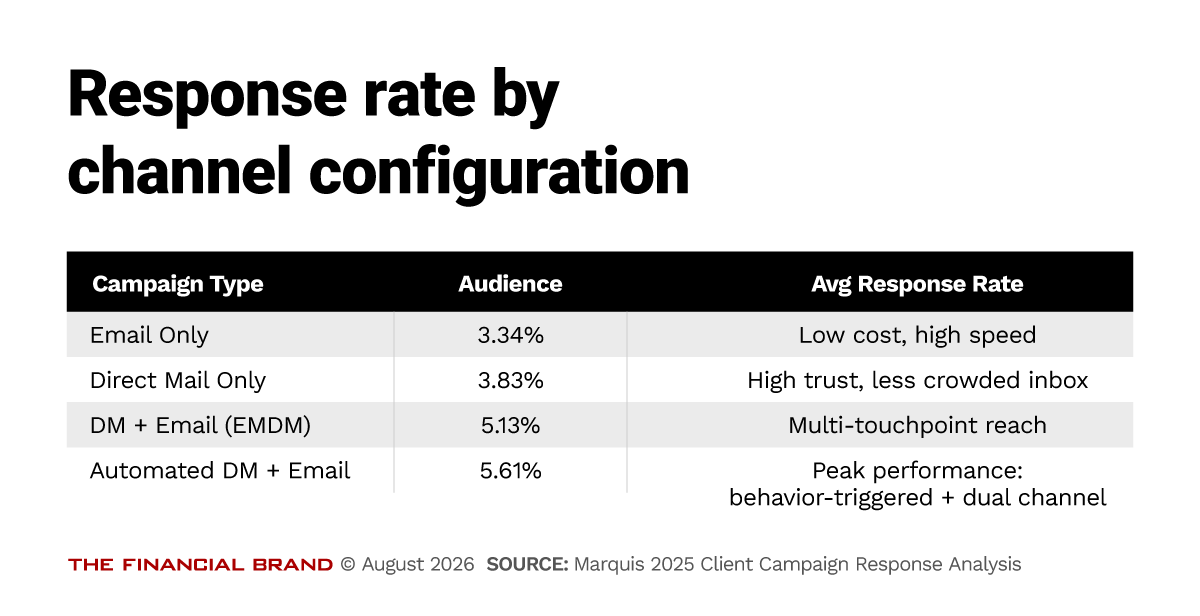
Email-only campaigns in the dataset averaged a 3.34% response rate. Direct mail-only averaged 3.83%. Combined campaigns averaged 5.13%, and automated combined campaigns hit 5.61% — a 68% improvement over email alone. The ANA/DMA 2025 Response Rate Report benchmarks financial services direct mail at 4.4%, and 84% of marketers in Lob’s State of Direct Mail survey call it their highest-ROI channel. At roughly one to two dollars per contact and a 3.83% response rate, the cost per response runs twenty-six to fifty-two dollars — for a checking account relationship worth three to four hundred dollars in annual net revenue.
Institutions that have pulled back from direct mail are often comparing the wrong number — cost per send instead of cost per response. On a cost-per-response basis, combined channels consistently outperform the cheaper option running on its own.
The Real Personalization Gap
Most financial institutions describe their marketing as personalized. Their account holders see it differently. Only 11% of banking consumers in a Salesforce survey agree their institution anticipates their financial needs, and the ABA’s 2026 bank marketer survey found only 9.7% of respondents are customizing outreach at the individual account holder level. That gap between what institutions believe they are doing and what account holders actually experience is where a significant amount of marketing budget quietly disappears.
The most common version of ‘personalization’ in financial institution marketing is a first name in a subject line. An account holder who receives a mortgage offer addressed to them by name — while they are already three months into a mortgage at a competing institution — has not experienced personalization. They have received evidence that their bank does not know them.
What Marquis’ data shows is that relevance-driven targeting is what actually moves response rates. New product campaigns, built around an account holder’s actual product gaps relative to peer households, averaged 6.74%. Good Manners campaigns, tied to a personal milestone like an account anniversary or birthday, averaged 5.08%. Onboarding campaigns, triggered by an actual account opening event, averaged 8.84%. All three significantly outperform the 4.17% overall average. And all three were sent to the right person at the right time — not just to everyone on a list.
Across all four patterns, the root cause is the same. The best-performing campaigns are built on connected, current account holder data — individual signals, not demographic assumptions or calendar schedules. Real personalization is not about what the subject line says. It is about whether the campaign should have been sent to that person in the first place. Institutions that have built the infrastructure to answer that question correctly are seeing it clearly in their response rates.


