
Stop Chasing Perfect Attribution and Start Building Better Evidence
By Nicole Volpe
Simple Subscribe
Subscribe Now!
Financial institutions are spending across an expanding mix of channels, but their ability to measure performance varies dramatically. Paid search, email, and direct mail can often be tied directly to outcomes; TV, CTV, outdoor and other upper-funnel activity cannot. Meanwhile, most customers encounter multiple channels before opening an account or applying for a loan—and many ultimately convert in a branch — making attribution even harder.
That leaves bank and credit union marketers in a familiar bind: They may have access to channel-level metrics but they don’t know what’s driving incremental growth. The problem becomes particularly acute at budget time, when the CMO needs to decide what to increase or cut, and to explain those decisions to the CFO.
Key insight: Continuing to chase a comprehensive, and likely expensive, attribution solution may not be the answer. “There’s no silver bullet and there’s no great solution, especially for mid-sized financial institutions,” said Scott Hopkins, EVP at Anderson, a growth marketing agency focused on financial services. A more useful goal, he argues, is for these institutions to build their own storehouses of insights and comparables, sufficient to support increasingly confident marketing decisions.
To understand what such a solution might look like, it’s helpful to first take a closer look at why attribution is so hard.
Apples, Oranges, Lemons, and Cats
Part of the problem is structural. Campaigns in different channels are often handled by different teams or agencies, each using its own attribution models and metrics. A bank or credit union might use one partner for digital media and another for traditional media, and yet another for direct mail and email.
The resulting performance data can be difficult to reconcile: impressions, clicks, and leads; inbound and outbound calls — all of these are measured differently and may use different attribution windows or customer identifiers. Nor does that data always connect cleanly to the CRM, core, or other systems of record. The net result is a fragmented view of the customer journey, and critically, an incomplete picture of which activities contributed to a given business outcome.
Resolving overlap poses an especially acute challenge because many customers interact with multiple channels and campaigns before converting. It is more pronounced higher in the funnel. To some degree this is intentional: Television, outdoor, and other awareness media are expected to increase the likelihood of down-funnel actions. Their contribution may be significant but is much harder to measure with confidence.
Key insight: The answer, then, is not to force all of those signals into a definitive attribution model. It is to build a performance measurement approach that relies on ground truth and is rooted in an institution’s own experience. Achieving this requires adopting a core routine that becomes self-sustaining over time: Establish baselines, run controlled tests, accumulate structured learning over time — and then repeat.
Step 1: Establish Baseline Data
Hopkins advises institutions to begin with the channels they can measure. Paid search, email, and direct mail typically generate reliable response data that can be tied back to leads and conversions. That means putting measurements in place for current programs and campaigns and connecting response data as closely as possible to actual customer outcomes.
This creates a baseline against which marketers can judge whether additional activity will improve performance. Even here, perfect attribution is not the goal; consistent measurement is. This step can also expose gaps between channel reporting, CRM data, and actual account-opening or loan-conversion data.
Step 2: Test for Incremental Lift
With baseline data in place, Hopkins said, the next step is to execute controlled market or “holdout tests” that reveal whether a particular activation or intervention produces lift and quantifies that impact. In these tests, the marketer holds out part of the target segment and excludes it from the intervention.
For direct mail, a credit union targeting 200,000 households for a checking-acquisition campaign might randomly withhold 20,000 from the mailing, then compare account-opening rates between the mailed and unmailed groups. For upper-funnel media, a regional bank might run streaming TV and outdoor ads in several comparable markets while leaving others untouched, then compare changes in branch activity, new-account openings or application volume across the two groups.
Hopkins described an Anderson client that examined the halo effect of direct-response TV (DRTV). Using test groups of non-DRTV states and states with DRTV, the client tracked each group’s performance during DRTV “on” weeks and DRTV “off” weeks. During weeks when DRTV was running, markets receiving the advertising outperformed non-DRTV markets across nearly every measure: website new users were up 21% in DRTV states versus down 5% in non-DRTV states, while calls rose 16% versus a 0.7% decline. Enrollments increased in both groups but rose 22.9% in DRTV states compared with 17.3% elsewhere.
Key insight: It’s important to note that test groups such as holdouts require sufficient scale and time to be meaningful. While testing does not enable precise attribution, Hopkins said, it does provide strong quantitative evidence that can justify future decision-making.
Step 3: Build an Evidence Base Over Time
As an institution performs more tests, it can build, and maintain, a knowledge base that synthesizes and consolidates its learnings across campaigns for use in future planning.
Matchback analysis can show whether the same prospect appeared in multiple response files — for example, someone who responded to direct mail also later clicked paid search. Cohort analysis can then compare how different groups behaved — for example, whether prospects who responded through two or three channels converted at a higher rate than those who responded through only one, a pattern Hopkins said he has seen in client work.
In one example, he said, a client tracked performance of pay-per-click (PPC) advertising and direct mail (DM). Across three years, prospects who responded through both PPC and direct mail consistently converted at higher rates than those responding through either channel alone.
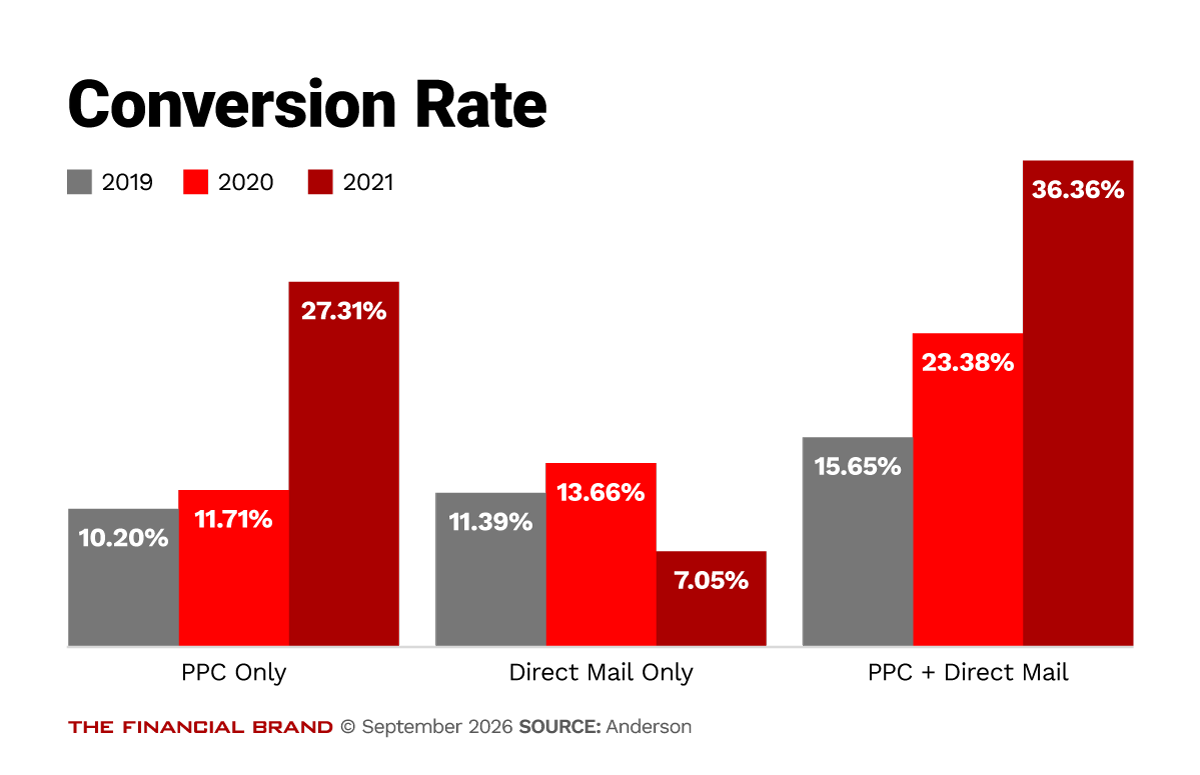
Repeating analyses like these across campaigns and markets gradually builds a more useful picture of which channel combinations tend to reinforce one another. It gives marketers evidence, specific to their institution, that can bring new discipline to campaign design and media planning.
Right-Sized Rigor
Like every enterprise doing business today, banks and credit unions struggle with marketing attribution. Even their largest competitors, with sophisticated models and massive data budgets, lack confidence in their ability to consistently manage and measure cross-channel performance.
Bottom line: For banks and credit unions, there is an alternate path. By adopting a methodical approach based on internal evidence and experience—and suited to the scale and scope of their operations—these institutions can cost-effectively improve the quality of their decision-making. Across all marketing activities, the overriding question becomes whether each campaign leaves the institution smarter than it was before.


