The Great Recession (2008-2009) triggered by the financial crisis/meltdown began in late 2007, and had many effects on consumers, businesses and the financial services industry.
I’ve spent my entire career figuring out why some financial institution branches perform better than others, and then using those findings to help banks and credit unions make better branch site selection decisions. During that 40-year career, I’ve opened more than 1,000 new branches… and closed another 2,000.
Now that we are a decade past this challenging period, let’s review any lingering effects it might have had on bank branch performance.
Recession Era Branches Bring in Fewer Deposits
So, let’s look back. In the five years prior to the Great Recession, there were over 11,500 traditional denovo branches built (excluding supermarket branches). That comes to an average of about 2,300 annually.
The first impact of the Recession was a reduction in new branch building, as banks acted to reduce expenses and conserve capital. During 2008-2009, only 2,900 branches were built, or about 1,450 per year — down about 37%. Post-Recession, the number has been around 900 annually, a fall of about 60% from pre-Recession levels. You’ve all read many articles about the increase in branch closures during this time period, and together these trends are why the total number of branches has slowly declined about 1% annually these past few years.
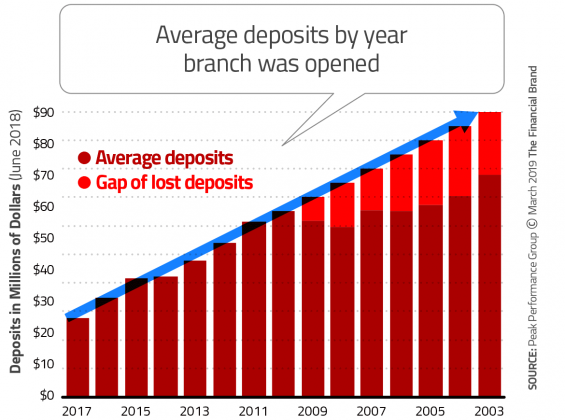
The second impact? Branches opened during the Recession, and immediately prior, have suffered with slower deposit growth than those branches opened after it ended in 2009. The over 7,000 branches opened in the last eight years have shown steady growth in average deposit balances, reaching nearly $50 million by year 5 and $65 million by year 8. Note: These figures exclude supermarket branches, which generally underperform traditional branches by 60%-70%.
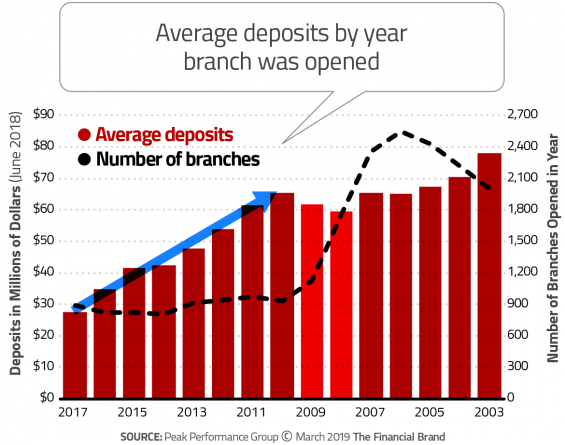
Note: The Financial Brand’s editorial team debated at length about how the years in the chart above should run — 2003 through 2017, or the other way around. Ultimately we decided to emphasize the growth of deposits over time by putting branches that were more recently opened on the left side of the chart. It makes sense when you study the graph.
Read More: 14 Stunning Branch Designs From Banks and Credit Unions Around The World
What Changed About Branches Post-Recession?
Why do these two groups of branches perform differently? A detailed examination of these years reveals a few things.
1. Are financial institutions being more selective nowadays where they build new branches? The facts suggest that’s a factor. Prior to the Great Recession, new branches were being built in 147 MSAs in the U.S., or about 38% of all metro areas. Post-Recession, new branches are being built in only 118 MSAs annually on average, or 31% of all MSAs. Branch investments are expensive, so being more careful with those decisions makes a lot of sense.
2. Are banks concentrating on only the biggest markets? Not exclusively, but yes, they are placing more emphasis in those bigger markets. Prior to the Great Recession, the top five MSAs contained 24% of all new branches. Post-Recession, the top five MSAs comprise 27% of new branches being built. Similar trends have been seen for the top ten MSAs too — 36% prior to Recession and 39% post-Recession. This higher concentration in top ten markets makes sense as these geographies gather deposits at a rate 30% higher than new branches overall.
3. Are financial institutions avoiding building new branches in rural areas (non-MSAs)? It doesn’t appear so. Pre-Recession, these rural areas comprised 23% of new branches and post-Recession it comes to 22%. One interesting note, though, is that in the last two years 25% of new branches are being built in rural areas. I find this fact fascinating, because new branches in rural areas gather deposits at a rate about 25% lower than new branches overall.
4. How do we gauge the impact to those new branches opened just prior and during the Recession? One way to examine the data is to extend post-Recession trends back further and determine the gap in deposit levels for branches opened in this earlier period. It usually takes over 20 years before new branches reach their “maturity,” at which point deposit growth slows. New branches opened pre-Recession hold $8-$25 million less than expected for the length of time opened. Translating those “lost” deposits into revenue using a loaded 4% spread equals $320,000-$1,000,000 in lost annual revenue. Given that there would be little incremental cost for those deposits, as the institution has already sunk the costs to build and staff the branch, those revenues are nearly all lost net income or profits.
Read More: Getting Branch Design Right in the Digital Age
All these facts raise some interesting questions. Did some banks get scared of new branch building because of the poor performance in the early years of branches opened just before and during the Great Recession? Is it time to reconsider new branch building again, given post-Recession denovo success?
Given that the net decline in total branches has reduced competition, perhaps there is greater opportunity to perform well for those institutions willing to act on these trends.