At a time when most of the discussion in the financial services industry is around Millennials, another generation is driving more financial activity, a higher growth rate in digital channel use, and the greatest amount of banking and credit union revenues of any generation in history. This generation is the combination of sub-generations that make up the 50+ age cohort.
The impact of this generation is what AARP has branded the Longevity Economy, representing the sum of all economic activity driven by the needs of Americans aged 50 and older, and includes both products and services they purchase directly, and the further economic activity this spending generates.
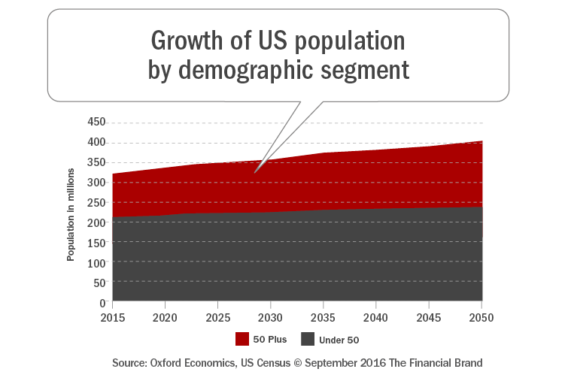
There are more than 1.6 billion people in the world who were part of the 50-plus cohort as of 2015, with 111 million residing in the U.S. alone. By 2050, the global number is projected to double to nearly 3.2 billion people. This growth is having a transformative impact, economically and socially, with individuals staying employed for longer, spending more money and helping to fuel economic growth for an extended period of time.
The Longevity Economy
The white paper produced by AARP in conjunction with Oxford Economics entitled, The Longevity Economy: How People Over 50 Are Driving Economic and Social Value in the US states, “What is unique about the 50+ population, is that the 30 years added to lifespans in the 20th century have resulted in a longer middle age – extending the period when workers are at their most productive and creative, and representing a major, often untapped resource.” The report continues, “Rather than being a burden to society, the 50+ segment continues to fuel economic activity far longer than past generations had, and those born after them will continue this trend.”
Key findings from this report include the following:
- The 50-plus cohort represented approximately 35% of the US population in 2015 and was responsible for over $7.6 trillion in annual economic activity (roughly 42% of total US GDP).
- Direct spending on consumer goods and services, including health care, by those aged 50 and over amounted to $5.6 trillion in 2015.
- Approximately $1.8 trillion in federal, state and local taxes were attributable to the Longevity Economy in 2015—about 34% of federal tax revenue and 41% of state and local tax revenue collected in the US.
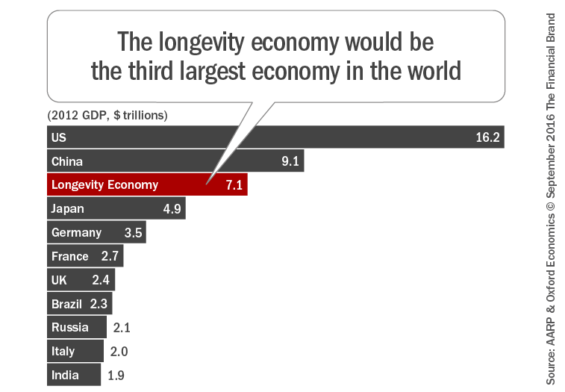
In the aggregate, the Longevity Economy is larger than any other country’s economy, except those of the United States and China. As a result, over-50 Americans have resulted in products and services being tailored to meet the needs of this population – improvements that have subsequently become standard for other consumers. This includes, but is not limited to changes in packaging, benefits, offers, and even digital delivery.
According to AARP and Oxford Economics, the 50-plus cohort comprises approximately 35% of the US population and includes four distinct generations:
- The GI Generation: born between 1901 and 1926
- The Silent Generation: born between 1927 and 1945
- Baby Boomers: born between 1946 and 1964, and
- Generation X (Gen X): born between 1965 and 1980 – the youngest of whom turned 50 years old in 2015
By 2050, Gen Xers and Millennials will be part of the 50+ age group, contributing to the Longevity Economy. Between 2015 and 2050, the 50-plus cohort is projected to grow by 45%, while the under-50 population expands by just 13%. This illustrates the importance of serving the Millennial and GenX segments, but also highlights the importance of building a strategy to serve older, increasingly diverse and economically important segments.
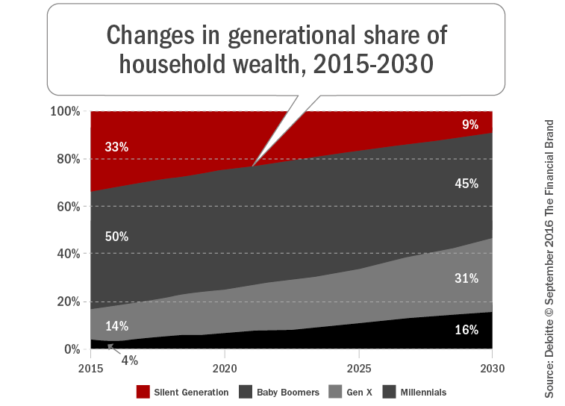
The economic value of the 50-plus year old group is largely the result of their share of wealth. For instance, 83% of US household wealth is held by people over 50. The relative strength in terms of household wealth will change over time as different generations age through 2030.
The Longevity Economy also are the most active spenders. Not only does the 50-plus cohort spend more overall than their under- 50 counterparts, the 50-plus cohort accounts for a majority of the spending in several categories including financial services.
Read More:
Busting Stereotypes
This generation is much more active than those who preceded them, with this mobility leading to a greater acceptance of products, services and apps that simplify daily living and are accessible 24/7/365. This includes mobile apps and IoT devices that are easy to use, personalized and contextual.
According to the AARP report, “New technologies such as remote monitoring, smart homes, ambient computing and GPS tracking are just the tip of the iceberg. Increasingly, appliances, gadgets, software programs and sensors connected via the Internet of Things will appeal to the 50+ segment. New technology that benefits all consumers often finds new uses among the 50-plus population. For example, smart phone apps that remind people when to take medications as well as allow them to connect to loved ones.”
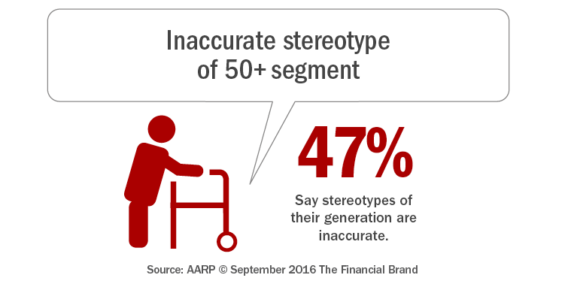
Counter to stereotypes, people in the 50+ segment are driving demand for and funding a multitude of new products and services, especially ones that adopt technological innovations. According to Forrester Research, people aged 46-64 comprised approximately 25% of the total population in 2010, but accounted for over 40% of technology purchases.
This segment shops online with a frequency similar to that of younger consumers, but they spend more (those between 46 and 64 spent an average of $650 online over a three-month period, compared with $581 for Gen X). It is assumed that these trends will only increase over time.
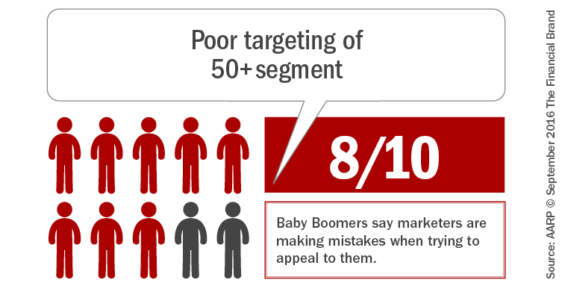
For marketers, the challenge is to completely understand both the 50+ age cohort as well as the Longevity Economy in total. Without an up-to-date understanding of the beliefs, behaviors and product usage patterns of this segment the power of personalized communication is lost.
The Payoff for Financial Services Firms
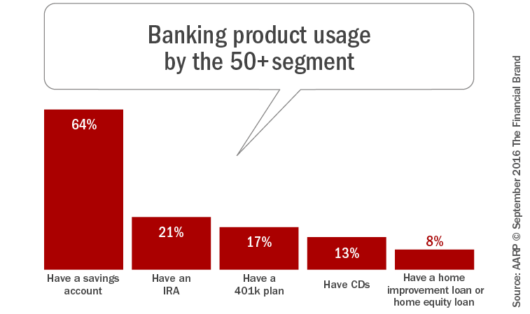
It comes as no surprise that the usage of financial services is higher for the 50+ age segment than any other segment. They have greater wealth, have more sophisticated financial needs and are more familiar with financial service options than any other generation. The penetration of financial services use is especially strong in deposit services categories.
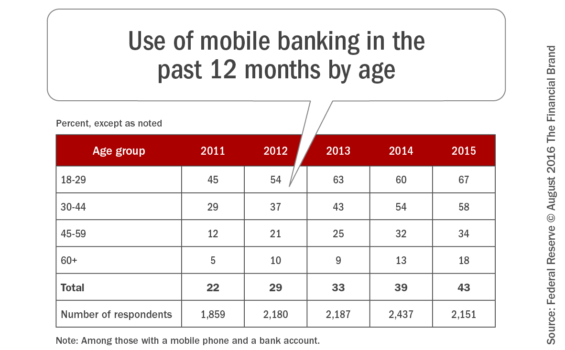
Not surprisingly either is that younger consumers are more likely to use mobile banking than older consumers. According to the Federal Reserve Board report, Consumers and Mobile Financial Services 2016, For those with a mobile phone and a bank account, 67% of those in the 18 – 29 age range used mobile banking in 2015 compared to only 34% for those in the 45 – 59 age group.
While usage has generally increased from year to year for all age groups, the rate of growth has been the highest for the older segments, who were slower to adopt mobile banking initially. In fact, given the size of the demographic segment, the 50+ cohort provides one of the last great targets for growth of mobile and online banking.
To provide a better foundation for growth of digital banking within this segment, however will require some rethinking of how mobile banking is delivered from a design perspective. To embrace the challenge and appeal to the 50+ segment, Kevin Tynan has outlined some very important design changes that will work for all age categories:
- Use a standard, easy-to-read font, no smaller than 12-point. Give users the option to increase text to their desired size.
- Make hyperlinks larger to be more readable and a better target for aging eyes.
- Avoid pull-down menus and other moving interface elements. It’s better to use static user interface widgets and designs that don’t require pixel-perfect pointing.
- Keep changes to a minimum. Drastic design changes frustrate older generations the most. Half of all seniors in one study said they keep a list of steps and instructions about how to use websites they often visit.
According to Jody Holtzman, Senior Vice President, Market Innovation, AARP, ”Why would you leave money on the table by ignoring the only humongous growth market that exists?!”
So the question for financial institution executives is simply … What is your 50+ strategy?