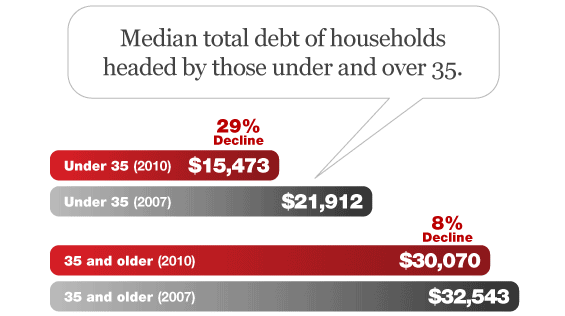
According to a Pew Research Center analysis of data from the Federal Reserve and other government sources, the median debt of households headed by an adult younger than 35 fell by 29% between 2007 to 2010, compared with a decline of just 8% among households headed by adults ages 35 and older.
Also, the share of younger households holding debt of any kind fell to 78%, the lowest level since the government began collecting such data in 1983.
Among young adults, a quarter of households owed $516 or less to their creditors in 2010. Though half owed $15,473 or less, a significant segment of young adults had much larger amounts of debt. A quarter of young adult households owed at least $106,768, and the most indebted 10% owed at least $207,758.
Pew says these shifts in the debt profile of younger adults reflect a broader societal shift toward delayed marriage and household formation that has been under way for decades.

Learn how to enhance your brand’s local visibility, generate more leads, and attract more customers, all while adhering to industry regulations and compliance. Read More about The Power of Localized Marketing in Financial Services Services that scale with you.

The Power of Localized Marketing in Financial Services

Fractional Marketing for Financial Brands
Credit Card Debt Balances Declining
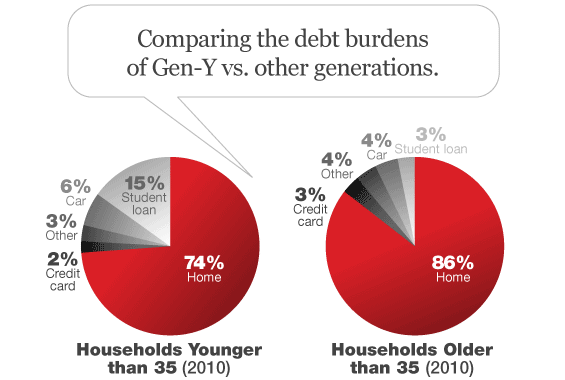
Younger households have pared their credit card balances. In 2010 only 39% of them carried a balance, down from 48% in 2007 and 50% in 2001. The median outstanding amount owed among younger households with balances has fallen over the decade from $2,500 in 2001 to $2,100 in 2007 and diminishing further to $1,700 in 2010.
Student Debt on the Rise
Student debt was the only major type of debt to increase in prevalence among young households during the recession. In 2007, 34% of young households had outstanding student debt, increasing to 40% by 2010. However, the median amount owed by households with student debt fell from $14,102 in 2007 to $13,410 in 2010.
More Young Consumers Say No to Car Loans
In 2007, 73% of households headed by an adult younger than 25 owned or leased at least one vehicle. By 2011, only 66% of these young households had a vehicle.
Among households younger than 35, outstanding vehicle debt declined from 2007 to 2010. In 2007, 44% of households younger than 35 had vehicle debt, but by 2010 that number had dropped to 32%. The typical outstanding amounts owed among young households with vehicle debt fell from $13,000 in 2007 to $10,000 in 2010.
Pew notes that the decline in vehicle ownership may be a reflection of declining preferences to drive among the young adult population. Federal Highway Administration figures indicate that the number of licensed drivers between the ages of 18 to 34 increased from 58.2 million in 2001 to 60.3 million in 2011. So the share of young adults with a license fell from 86% in 2001 to 83% in 2011.

Fewer Home Loans on the Horizon
The share of younger households owning their primary residence fell sharply from 40% in 2007 to 34% in 2011. Among younger households, the fall in ownership was accompanied by a decline in how many younger households had debt secured by residential property. In 2007, 38% of younger households had debt secured by residential property. By 2010 only 35% had such debt. The median outstanding amount of residential property debt owed (by younger households with such debt) fell from about $150,000 in 2007 to $128,000 in 2010.
The ranks of new homeowners fell between 2001 and 2011. In 2001, 2.54 million previous renters became homeowners. In 2011, 1.61 million renter-occupied households became homeowners.
In 2001, about 1.3 million young adults who had been renters became homeowners over the prior year, while 1.4 million who were previously homeowners became renters over the prior year.
By 2011 the flows in and out of homeownership among young adults were more lopsided. About 1.5 million young adult households who were previously homeowners became renters, but only 900,000 young adult renters became homeowners.
Debt-to-Income Ratios
One way to measure a household’s financial well-being is its debt-to-income ratio, which compares total outstanding debt to annual income. As the figure to the right indicates, the debt-to-income ratio of younger adult households more than doubled from 1983 to 2007, when it peaked at 1.63. By 2010 it had fallen back to 1.46. By contrast, the ratio among older households continued rise through this entire period. As of 2010 it has risen to 1.22, still below that of younger households.
You can download the complete 41-page report “Young Adults After the Recession” as a PDF instantly from the Pew Research website.


