In the latest report from the FDIC titled: “Brick-and-Mortar Banking Remains Prevalent in an Increasingly Virtual World” a reader would get the impression that the continued prevalence of brick-and-mortar offices supports the continued value of physical facilities in an increasingly digital world.
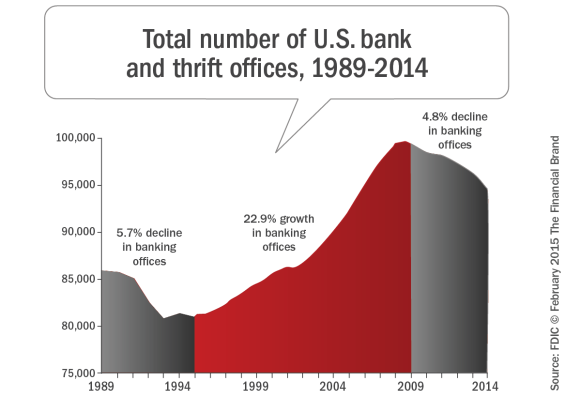
According to the report, FDIC-insured institutions operated 94,725 banking offices (or branches) as of June 2014, a decline of 4.8% from the all-time high of 99,550 offices in 2009. While there is evidence that post the Asian Crisis of 1987 there was also a decline in branch activity, the FDIC does not see this 5.7%% decline as significant.
There are some serious flaws in the research. And it is these gaps that could come back and hurt banks that do any long-term planning based on the FDIC’s report.
The report is derived mostly by taking the FDIC’s own data on branches and comparing it with economic cycles, historical events that changed branch networks, and general real-estate activity. In the report, the FDIC concludes that online and mobile banking, while clearly now the primary day-to-day method of banking and increasing readily in utilization, have not had a short-term impact on the number of branches in the United States. The conclusion is that the recent decline in branch activity is just as likely to be the outcome of the economic crisis as it is any other factor.
However, one paragraph in the report stands out because of the fact that the FDIC doesn’t posit a reasonable theory as to what these changes mean for branches. Here’s the paragraph:
“The cumulative effect of these new technologies has been a decline in the number of transactions taking place at physical banking offices. One study shows that the average number of teller transactions per office declined by 45 percent between 1992 and 2013, from 11,700 transactions per month to 6,400. Using a credit or debit card has become more common than writing a check. According to Federal Reserve data, paper checks accounted for only 15 percent of non-cash payments in 2012, down from 46 percent in 2003.”
So here is the research gap. In-branch teller transactions and check transactions have plummeted over the last two decades with the arrival of the Internet, but the FDIC sees no discernable effect on physical branch numbers. With a 45% decline in transactional activity and a 68% decline in check use, there has been virtually no impact on branch activity according to the FDIC.
What they are suggesting is basically statistically impossible. It either means that something else is happening at those branches that has made them increasingly viable between 1990-2015, or that the FDIC simply hasn’t yet found anything to suggest that this decrease in activity is impacting branch networks.
This is the FDIC’s set up to their answer to this conflict in the data:
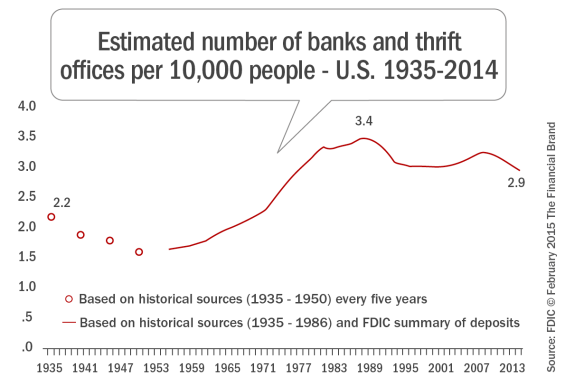
“In order to evaluate how technological alternatives may affect the total number of physical banking offices, a measure of how prevalent those offices are relative to the total demand for banking services is needed. If physical banking offices were indeed becoming less prevalent over time, then that would provide some evidence that new banking technologies may represent substitutes for those banking offices in serving bank customers. But if physical banking offices are as prevalent or more prevalent today than they were in the past, then perhaps technology should not be viewed as a perfect substitute for brick-and-mortar banking offices.”
The FDIC’s answer to this conundrum? The statistic they fall back on is branch density. Their suggestion is simple. If technology were changing branch utilization, then branch density would be falling. But given that they’ve already demonstrated it is minimally declining, the study is essentially a fait accompli in favor of continued investment in branching at this stage. Branch density hasn’t changed significantly, so digital is not impacting branching – that is their conclusion.
They do conclude that the largest 52 banks in the USA have pared back their branch networks, but they attribute that to the financial crisis, and not the fact that larger networks might be more sensitive to changes in customer behavior or utilization of branch networks. The other reason they attribute the slow down in new branches? Less charters being approved.
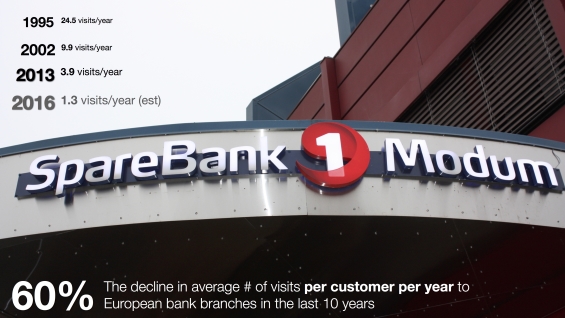
So what measure would realistically show (as a leading indicator) that online or mobile is having an impact on the viability of branch networks? There’s only one metric that matters and it isn’t transactional activity or branch density, but it is something that the FDIC simply doesn’t measure … the average number of visits to a branch per customer per year.
Other bank and regulatory bodies around the world are now starting to take notice of this number in a big way. FinansNorge (Finance Norway) has been measuring this data since 1995 when branch visits were at 24.5 times per year. In 2016, they estimate that the average Northern European will visit a branch only 1.3 times per year. Two of the top 4 banks in the US by their own internal estimates peg that number in the US at somewhere between 1.8-2.3 times per year in 2015. FinansNorge came to the conclusion that this activity would decrease branch density by 40% in Northern Europe. The FDIC says branch density hasn’t been affected. Who is right?
So how can the FDIC explain that the branch network in the United States today can sustain a 90% decrease in annual visits to a bank branch in the last decade and a half, along with a 50-70% decline in core in-branch transactional activity? The answer is, they can’t or they don’t.
The problem with the FDIC analysis is that it is looking at lagging indicators of branch health and not leading indicators. Where consolidation of branch networks has occurred, the banks that typically have purchased distressed networks are in growth modes, and for a time can sustain suboptimal branch networks.
The likes of First Niagara’s purchase of HSBC’s New England branch network is a case in point. The fact is those branches had failed HSBC, but First Niagara got a share price bump for their expansion when they purchased those offices. There’s nothing in the data to suggest that First Niagara as a brand could do any better with those same branches than HSBC did.
The FDIC also does not look outside its own data to see if there is any other related dynamics that informs the future of the branch problem. Other factors that are not discussed are the political (Community Reinvestment Act) or potential public relations ramifications of branch closures. They also don’t discuss the accounting impact of closing branch offices.
All three of these issues were well documented in an article by Jim Marous entitled, “Banks Can’t Close Branches Fast Enough,” where banks revealed that they are only closing a small fraction of the offices they would prefer to due to outside influences. In other words, banks are on the verve of closing thousands of offices that are no longer economically viable.
So we have a report that clearly establishes a strong behavioral shift when it comes to day-to-day banking, but a conclusion that branch density remains high, and previous contractions/growth of the branch network prior to the rise of the internet are perfectly valid assumptions to use in today’s environment. However, it doesn’t believe consumer behavior is a factor in the future of the branch, nor does it effectively measure it. They don’t even measure the profitability per branch and look if that has been affected by changing consumer behavior.
My guess is that if you had looked at bookstore activity a few years after the emergence of the Kindle you would have probably seen the same thing. Bookstore density was good and online activity wasn’t affecting the business too much.
In fact, a study in 2003 by the Yale School of Management and the University of Chicago Graduate School of Business entitled “Measuring Prices and Price Competition Online: Amazon and Barnes and Noble,” it was concluded that while price elasticity could be seen as more volatile in bookstores with the emergence and success of Amazon, that it was not yet effecting bookstore popularity or the density of bookstores.
Similar to the FDIC, the report didn’t take into account the number of times customers were visiting a bookstore annually.
The continued view of lagging vs. leading indicators by the FDIC’s is best illustrated by the concluding paragraph in their report:
“This analysis shows that physical offices remain a vital channel through which FDIC-insured institutions deliver financial services to their customers. New technologies have certainly created convenient new ways for bank customers to conduct business, yet there is little evidence that these new channels have done much to replace traditional brick-and-mortar offices where banking relationships are built. Convenient, online services are here to stay, but as long as personal service and relationships remain important, bankers and their customers will likely continue to do business face-to-face.”
The FDIC needs the right data to make recommendations to the US banking community, and in this case, they simply don’t use the right data. They’ve never had to measure it before, because they’ve never had a negative effect from changes in consumer behavior before.
It’s time they measure the right leading indicators. It’s time the FDIC looks at the future of banking, and not just at the past.