Chief marketing officers at every credit union perennially ask: “Is my marketing budget large enough?”
To help credit union leaders gain some context as they evaluate their own budgeting decisions, The Financial Brand pulled the marketing budgets of a random sampling of credit unions ranging from about $250 million in assets up to the largest in NCUA’s database. We gathered year-end totals for 2015 and 2018 from the “educational and promotional expense” listed in their call reports.
Number of Credit Unions in Study: 227
Largest Credit Union by Assets: Navy Federal, Vienna, VA ($97 billion)
Smallest Credit Union by Assets: Library of Congress FCU, Washington, DC ($251.3 million)
Average Marketing Budget: $3,385,769
Media Marketing Budget: $1,250,621
Average Marketing Budget as a % of Assets: 0.120%
Median Marketing Budget as a % of Assets: 0.120%
(Check out a similar study from The Financial Brand on bank marketing budgets. Also see roundup articles discussing 2020 marketing budget decisions with credit union and bank marketers.)

The Power of Localized Marketing in Financial Services
Learn how to enhance your brand’s local visibility, generate more leads, and attract more customers, all while adhering to industry regulations and compliance.
Read More about The Power of Localized Marketing in Financial Services

Move the Needle from Attrition to Acquisition
Vericast’s 2024 Financial TrendWatch explores seven of today’s most critical financial services trends to provide a complete view of the current loyalty landscape.
Read More about Move the Needle from Attrition to Acquisition
Benchmarks to Compare Where Your Credit Union Stands
Compared to banks, credit unions are growing more aggressive with their marketing. As more and more credit unions pursue broader markets, they inevitably bump up against greater competition. So it isn’t surprising that they find it useful to allocate more to marketing to make their presence felt not only versus traditional banks and other credit unions, but against the growing encroachment of fintech competitors.
Consider Jovia Financial Credit Union. Originally serving a tight member group — teachers of a single school district — the institution now serves consumers in the New York City suburb of Long Island, one of the most competitive markets for financial services in the country. In our study, Jovia’s marketing budget saw an annual year-over-year increase of 20.1%. At the end of 2018, their marketing spending represented 0.22% of assets — nearly twice twice the average of similarly sized credit unions (0.12%.) During this period, Jovia’s assets grew 32.6%. Jovia clearly decided to invest in growth.
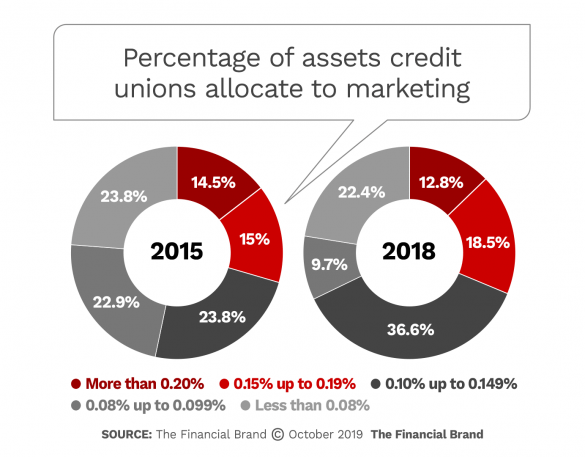
While individual institutions’ spending vary according to circumstances and resources available, the industry as a whole is tending to grow its marketing spending. In 2018 the portion of the sample group spending over 0.10% of assets on marketing hit 67.9%, versus 53.3% in 2015.
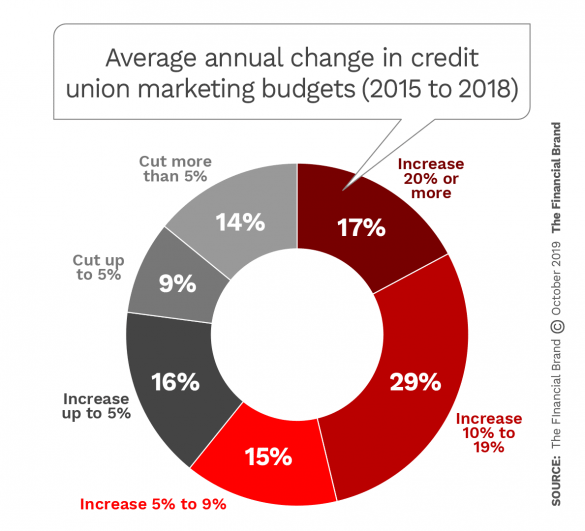
Looking at overall trends in spending another way, The Financial Brand examined patterns over the three-year study period. As shown in the chart below, over a third of the sample had an average annual increase in marketing spending over 2015-2018 of 10% or more. Of those credit unions, 17% of the sample averaged annual increases of 20% or more.
Interestingly, as the table below shows, in all but one asset tier among the credit unions there were increases in another key measure of the industry’s use of marketing: marketing dollars spent per member. The most significant dollar increase seen when 2018 and 2015 budgets were compared was among credit unions in the $5 billion to $10 billion class.
| Credit Union Marketing Allocations as a % of Assets |
Marketing as a % of Assets (2015) |
Marketing as a % of Assets (2018) |
|---|---|---|
| Over $10 Billion | 0.08% | 0.09% |
| $5 Billion to $10 Billion | 0.10% | 0.12% |
| $1 Billion to $5 Billion | 0.12% | 0.13% |
| $500 Million to $1 Billion | 0.15% | 0.13% |
| Less than $500 Million | 0.13% | 0.13% |
| Marketing Per Member By Asset Tier | Marketing $ Per Member (2015) |
Marketing $ Per Member (2018) |
Change in Marketing $ Per Member (2015-2018) |
|---|---|---|---|
| Over $10 Billion | $11.49 | $12.96 | $1.48 |
| $5 Billion to $10 Billion | $16.63 | $20.19 | $3.55 |
| $1 Billion to $5 Billion | $16.46 | $18.56 | $2.09 |
| $500 Million to $1 Billion | $16.33 | $15.64 | -$0.69 |
| Less than $500 Million | $14.24 | $14.86 | $0.62 |
Credit Union Marketing ROI
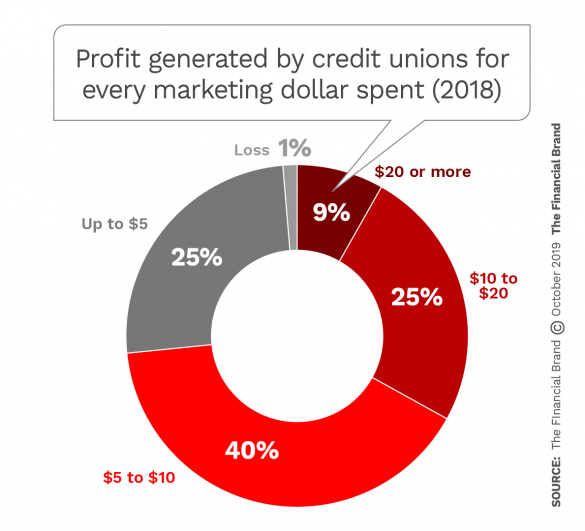
In 2018, the credit unions studied generated on average $16.39 of net income for every dollar they spent on marketing. This profit level compares to $12.22 in 2015 for the same group of credit unions.
Credit unions face a balancing act. As institutions that are focused on service to members and member-owned businesses there is a constant need to offer good deals while keeping the heat and lights on, growing membership to maintain a vibrant institution, and keeping up with the ever-growing list of technological “musts.”
The marketing department itself faces a lengthening list of necessities and staff skills. Having social media, data analytics, videography, and more talent on staff or readily at hand through consultants or agencies is not a luxury anymore.

How Marketing Supports Credit Union Growth
Establishing a definitive cause-and-effect relationship between marketing expenditures and results such as asset growth is as challenging as any engineering puzzle. Many factors go into the end results, but marketing clearly has an impact.
Of the 227 credit unions in our study, 40.1% increased assets by at least 25% between 2015 and 2018. Of these, 27% increased their marketing budgets by an average of at least 15% annually between 2015 and 2018.
| Marketing Spend Among Credit Unions With The Most Growth | Assets (2018) |
Asset Growth (2015-2018) |
Average YoY Increase in Marketing Budget (2015-2018) |
Marketing as a % of Assets (2018) |
|---|---|---|---|---|
| California | $3.1 B | 110.9% | 38.0% | 0.12% |
| Envision | $587.0 M | 90.9% | 24.6% | 0.14% |
| Neighborhood | $715.2 M | 82.1% | 32.7% | 0.20% |
| Greenstate | $5.4 B | 68.3% | 19.5% | 0.15% |
| Elga | $660.6 M | 50.8% | 24.4% | 0.41% |
| America First | $10.3 B | 43.8% | 16.9% | 0.14% |
| Affinity | $3.4 B | 41.0% | 19.3% | 0.15% |
| First Technology | $12.2 B | 40.8% | 28.4% | 0.07% |
| Patelco | $6.6 B | 39.0% | 20.3% | 0.06% |
| University Of Wisconsin | $2.8 B | 35.8% | 39.7% | 0.24% |
| Northeast | $1.5 B | 35.6% | 15.5% | 0.13% |
| Spokane Teachers | $3.0 B | 34.6% | 21.5% | 0.14% |
| First Source | $588.0 M | 34.5% | 16.8% | 0.21% |
| Carter | $350.2 M | 34.3% | 28.7% | 0.15% |
| Suncoast | $9.3 B | 34.3% | 16.3% | 0.24% |
| Randolph-Brooks | $9.3 B | 32.7% | 20.7% | 0.11% |
| Jovia Financial | $3.2 B | 32.6% | 20.1% | 0.22% |
| Navy | $97.0 B | 32.3% | 16.5% | 0.17% |
| Michigan Schools & Government |
$2.0 B | 31.3% | 22.0% | 0.16% |
| Utah Community | $1.4 B | 31.1% | 25.1% | 0.26% |
This table includes some of the industry’s leaders, including the largest U.S. credit union, Navy Federal. During the study period Navy Federal averaged increases in marketing spending of 16.5% annually, and in 2018 devoted 0.17% of its assets to marketing. Over the study period, Navy Federal grew assets by 32.3%.
Top of the table is California Credit Union, which serves four southern counties in the state. In 2017 it went through a merger of equals with San Diego’s North Island Credit Union and in 2018 spent on a major advertising campaign launching its new “With you. Wherever life takes you” slogan on TV, digital channels, billboards and social media.

Are You Ready for a Digital Transformation?
Unlock the potential of your financial institution's digital future with Arriba Advisors. Chart a course for growth, value and superior customer experiences.

Why Industry Cloud for Banking?
PwC’s Industry Cloud for Banking helps deliver personalized products and services that today’s customers expect.
Looking for the ‘Marketing ROI’ for the Spending
Two-thirds — 67.4% — of the 227 credit unions studied allocated at least 0.10% of their assets to marketing. Of these 154 credit unions, 21 were able to generate at least $10.00 in profit for every dollar spent on marketing, as shown in the table below.
Marketing return for each dollar spent
| Credit Union | Assets (2018) |
Marketing as a % of Assets (2018) |
Profit Per $1 in Marketing Spent (2018) |
ROA (2018) |
|---|---|---|---|---|
| Genisys | $2.6 B | 0.12% | $15.04 | 1.83 |
| AllSouth | $840.3 M | 0.11% | $14.07 | 1.59 |
| Tennessee Valley | $1.4 B | 0.11% | $13.61 | 1.43 |
| CPM | $356.0 M | 0.10% | $12.89 | 1.24 |
| Central Minnesota | $1.1 B | 0.10% | $12.51 | 1.22 |
| Clearwater | $524.4 M | 0.10% | $12.29 | 1.29 |
| Space Coast | $4.1 B | 0.10% | $11.84 | 1.24 |
| San Mateo | $1.1 B | 0.12% | $11.56 | 1.39 |
| Superior Choice | $476.1 M | 0.11% | $11.41 | 1.24 |
| Knoxville TVA Employees | $2.1 B | 0.10% | $11.36 | 1.11 |
| Orange County’s | $1.6 B | 0.10% | $11.26 | 1.10 |
| Austin Telco | $1.6 B | 0.12% | $11.13 | 1.37 |
| Gulf Coast Educators | $726.3 M | 0.12% | $11.13 | 1.38 |
| State Employees (NM) | $569.6 M | 0.11% | $11.04 | 1.17 |
| Boeing Employees | $19.6 B | 0.12% | $10.94 | 1.28 |
| CoVantage | $1.6 B | 0.10% | $10.53 | 1.05 |
| Randolph-Brooks | $9.3 B | 0.11% | $10.53 | 1.15 |
| Wasatch Peaks | $342.3 M | 0.12% | $10.49 | 1.28 |
| NavyArmy Community | $3.0 B | 0.10% | $10.44 | 1.00 |
| Alabama One | $606.5 M | 0.10% | $10.30 | 1.00 |
| OnPoint Community | $5.4 B | 0.14% | $10.28 | 1.48 |
Genisys Credit Union, doing business in Michigan, Minnesota, and Pennsylvania, launched both a new deposit program, “Genius Checking,” and a new mortgage program, in 2018. Given its heavy presence in Michigan, during the United Auto Workers strike of 2019 it was actively reaching out to union members impacted by the stoppage.
Read More:
- How Bank & Credit Union Marketers Can Stop Wasting Search Budgets
- Don’t Wreck Your Bank’s Brand Image With Cheap Stock Photos
- Maximizing Your ROI Requires The Right Marketing Attribution Model
The Impact of Marketing on Credit Unions’ Bottom Line
Out of the 227 credit unions studied, 27.8% increased their budgets by an average of 15% annually between 2015 and 2018. Among these credit unions, 18 saw their net income increase by an average of at least 50% during the study period and saw their ROA improve by at least 0.3 points.
| Credit Unions Generating the Biggest Bang for Their Marketing Buck | Assets (2018) |
Marketing as a % of Assets (2018) |
Average YoY Increase in Marketing Budget (2015-2018) |
Average Increase in Net Income (2015-2018) |
Change in ROA (2015-2018) |
|---|---|---|---|---|---|
| Premier Members | $1.1 B | 0.15% | 47.6% | 370.6% | 0.75 |
| Coastal | $3.2 B | 0.23% | 42.4% | 104.4% | 0.41 |
| Fedchoice | $372.9 M | 0.17% | 36.1% | 99.9% | 0.34 |
| Verve | $924.4 M | 0.30% | 32.2% | 73.2% | 0.30 |
| Carter | $350.2 M | 0.15% | 28.7% | 143.8% | 0.30 |
| ProFed | $436.0 M | 0.12% | 26.4% | 2645.3% | 1.00 |
| Pathways Financial | $290.9 M | 0.19% | 24.7% | 187.8% | 0.60 |
| TruMark Financial | $2.2 B | 0.16% | 23.8% | 131.4% | 0.34 |
| Michigan Schools & Government | $2.0 B | 0.16% | 22.0% | 71.5% | 0.31 |
| Credit Union One | $1.2 B | 0.32% | 21.4% | 113.5% | 0.41 |
| Patelco | $6.6 B | 0.06% | 20.3% | 117.1% | 0.36 |
| Affinity | $3.4 B | 0.15% | 19.3% | 233.8% | 0.36 |
| Credit Union West | $714.2 M | 0.13% | 18.5% | 142.8% | 0.43 |
| Tennessee Valley | $1.4 B | 0.11% | 18.4% | 61.9% | 0.32 |
| Navy | $97.0 B | 0.17% | 16.5% | 77.2% | 0.40 |
| Polish & Slavic | $2.0 B | 0.10% | 15.6% | 86.9% | 0.30 |
| San Mateo | $1.1 B | 0.12% | 15.2% | 124.9% | 0.63 |
| Fairwinds | $2.3 B | 0.18% | 15.0% | 94.6% | 0.50 |

Download The Marketing Budget Data (Excel Spreadsheet)
You can have your own copy of the data assembled and analyzed by The Financial Brand by providing the information in the form below. You will receive two spreadsheets — one for banks and one for credit unions. Here is just a sample of the datapoints these spreadsheets contain:
- Marketing budgets as a percentage of assets
- Breakdown of marketing budgets by asset tier
- Marketing budget increases
- Correlations between marketing budgets and profitability
- Profit per $1 in marketing spent
- Correlations between marketing budgets and asset growth
- And much, much more!
The ways in which you could slice and cross-tab the data are almost endless.
To receive the data, you must provide a valid email address. A link to the spreadsheet will be emailed to you.


