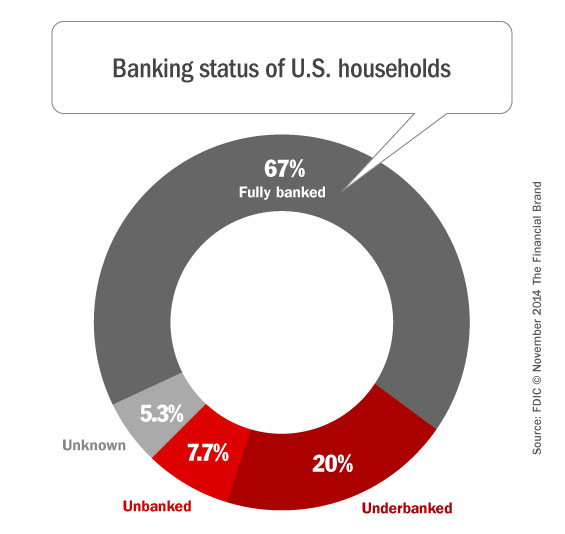
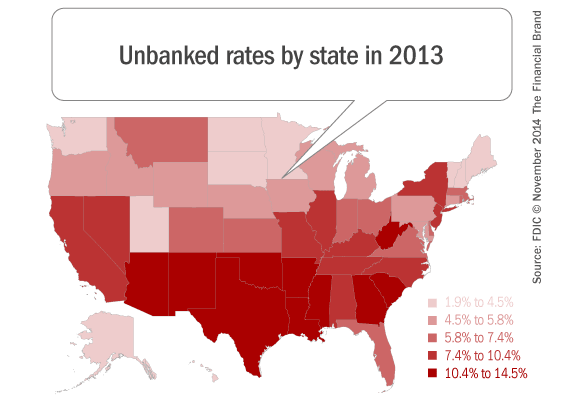
According to a bi-annual survey fielded by the FDIC, The vast majority of all U.S. households (88.4%) own a checking account. However, one in 13 households is unbanked, representing 9.6 million households with 25 million people (16.7 million adults and 8.7 million children). The proportion of unbanked households has declined slightly, from 8.2% in 2011 to 7.7% in 2013.
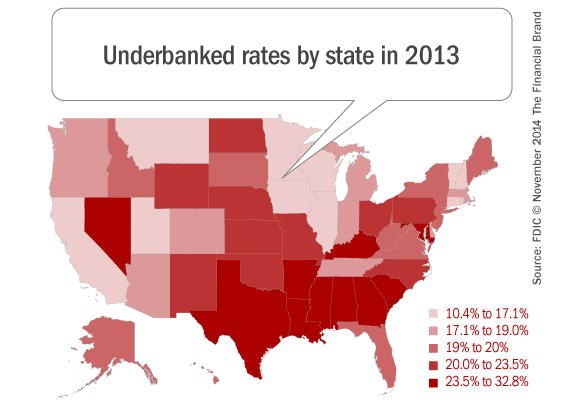
One in five or 24 million households are underbanked. Approximately 50.9 million adults and 16.6 million children lived in underbanked households.
The FDIC defines “unbanked” do not have any accounts with an insured institution. Anyone who has an account but has also obtained financial services and products from non-bank, alternative financial services (AFS) providers in the prior 12 months is considered “underbanked.”

Instant Messaging. Instant Impact.
Connect with your customers and provide lightning-fast support as effortlessly as texting friends. Two-way SMS text messaging is no longer optional.

Send the Right Offers to the Right Consumers
Achieve a better return on your marketing investment. Leverage behavioral data and analytics to target the right customers with the best possible offers.
Read More about Send the Right Offers to the Right Consumers
| Number of Households |
Unbanked | Underbanked | Fully Banked | |
|---|---|---|---|---|
| Household Type | ||||
| Married couple | 59,102,000 | 3.4% | 17.7% | 73.9% |
| Unmarried woman | 15,802,000 | 18.4% | 29.2% | 47.5% |
| Unmarried male | 6,327,000 | 13.2% | 28.3% | 53.7% |
| Single Woman | 22,150,000 | 7.4% | 17.2% | 69.4% |
| Single Male | 20,240,000 | 10.7% | 20.0% | 63.7% |
| Race/Ethnicity | ||||
| Black | 16,801,000 | 20.5% | 33.1% | 40.0% |
| Hispanic | 14,948,000 | 17.9% | 28.5% | 48.4% |
| Asian | 5,882,000 | 2.2% | 17.9% | 73.4% |
| American Indian/Alaskan | 1,464,000 | 16.9% | 25.5% | 53.0% |
| Hawaiian/ Pacific Islander |
314,000 | 6.1% | 25.1% | 64.5% |
| White | 84,310,000 | 3.6% | 15.9% | 75.4% |
| Spanish only/no English | 2,654,000 | 34.9% | 23.7% | 38.1% |
| Age | ||||
| 15 to 24 years | 6,244,000 | 15.7% | 30.8% | 48.8% |
| 25 to 34 years | 20,464,000 | 12.5% | 24.7% | 58.3% |
| 35 to 44 years | 21,408,000 | 9.0% | 23.8% | 62.5% |
| 45 to 54 years | 24,551,000 | 7.5% | 21.9% | 65.4% |
| 55 to 64 years | 22,710,000 | 5.6% | 17.7% | 71.7% |
| 65 years or more | 28,372,000 | 3.5% | 11.6% | 78.2% |
| Education | ||||
| No high school degree | 13,871,000 | 25.1% | 24.1% | 46.3% |
| High school degree | 33,684,000 | 10.8% | 21.9% | 61.7% |
| Some college | 36,007,000 | 5.6% | 23.0% | 66.2% |
| College degree | 40,188,000 | 1.1% | 14.3% | 79.3% |
| Family Income | ||||
| Less than $15,000 | 19,044,000 | 27.7% | 22.4% | 45.2% |
| $15,000 to $30,000 | 21,763,000 | 11.4% | 25.0% | 57.9% |
| $30,000 to $50,000 | 24,496,000 | 5.1% | 23.3% | 65.7% |
| $50,000 to $75,000 | 22,522,000 | 1.7% | 19.8% | 73.2% |
| Over $75,000 | 35,895,000 | 0.5% | 13.6% | 81.0% |
Why Consumers Forgo Banks
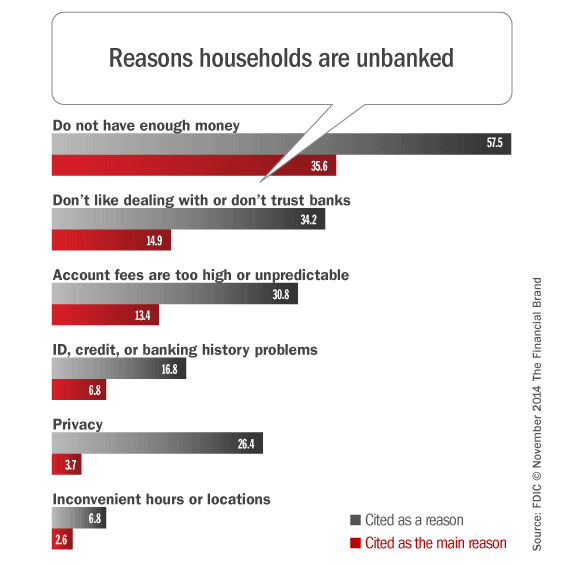
57.5% of unbanked households reported not having enough money to meet a minimum balance as a reason they did not have an account; 35.6% reported this to be the main reason.
34.2% of unbanked households reported their dislike of or distrust in banks as one reason they were unbanked; 14.9% reported this to be the main reason.
30.8% reported high or unpredictable account fees as one reason they did not have accounts; 13.4% reported this to be the main reason.
34.1% of households that recently became unbanked experienced either a significant income loss or job loss that they said contributed to becoming unbanked.
Are Banks Ignoring the Un/der Banked Opportunity?
Slightly less than half (45.9%) of unbanked households in 2013 were previously banked. Almost one in ten unbanked households became unbanked within the last 12 months.
Almost three out of four (74.8%) unbanked households that recently had a bank account, and 42.7% of unbanked households that had an account more than a year ago, reported being somewhat or very likely to open another in the next 12 months.
Among households that recently became banked, 19.4% reported that a new job contributed to their opening a bank account.
One-quarter of households have used at least one alternative financial service (AFS), such as non-bank check cashing or payday loans in the past year. In all, 12% of households used an AFS in the past 30 days, including four in 10 unbanked and underbanked households. AFS use is relatively high among unbanked households: 63.2% used an AFS in the last 12 months. Use of AFS transactions (e.g. check cashing) are much more common than the use of AFS credit (e.g. payday lending).
“The FDIC and the Consumer Financial Protection Bureau have been pretty vocal about the fact that they want to decrease consumer use of alternative financial services,” says Emily McCormick with Bank Director. “Will these regulators make a move to ensure that more Americans have access to a bank account?”
Whether regulators force banks to serve these consumers or not, Joan Susie at Bank Director says retail institutions are missing an opportunity.
“With well priced and carefully conceived products, these customers can be profitable,” Susie says. “Large banks, nonbank financial services companies and a few community bank pioneers are quickly realizing there is an even better reason than CRA credits to bank new immigrants and other underserved populations.”
Susie says that if banks don’t seize the opportunity, other players in the financial industry will.
“It is becoming clear that the biggest and savviest financial institutions are actively exploring ways to profitably provide access to credit and financial services for a significant segment of the population struggling financially,” Susie says. “The payday loan, with its predatory history and image, isn’t the only way to address this market.”
About 23% of bankers say underbanked customers present their greatest growth opportunity, according to a survey from KPMG.
Minorities Struggle With The Mainstream Banking System
The highest unbanked rates continued to be found among non-Asian minorities, lower-in- come households, younger households, and unemployed households. Relative to 2011, the unbanked rates in 2013 were generally similar for these groups. One exception is Hispanic households.
While still relatively high, the unbanked rate for Hispanic households decreased from 20.1% in 2011 to 17.9% in 2013. Improvements in economic conditions and changing demographics among Hispanic households over this period explain nearly half of the reduction in the unbanked rate among this population. In particular, relative to 2011, Hispanic households in 2013 experienced higher levels of employment, income, and education. These characteristics are all associated with a higher likelihood of having a bank account.


