The payments industry continues to evolve as digital technologies and mobile devices become increasingly a part of daily life. This evolution has changed the way traditional financial institutions build and deliver their products and services, and has spawned large numbers of fintech challengers hoping to compete by providing an enhanced customer experience.
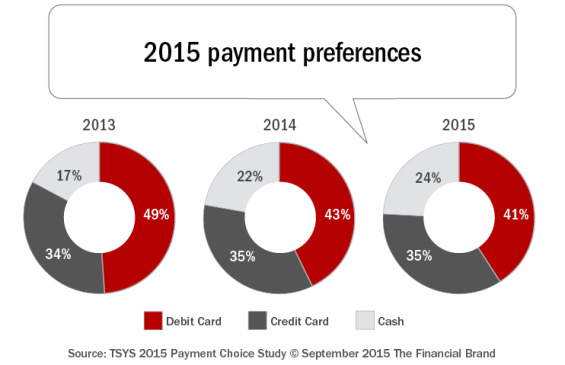
While the marketplace continues to change, the consumers’ payment preferences have changed much more slowly. According to the TSYS 2015 U.S. Consumer Payment Choice Study, debit continues to be the most preferred payment type overall, although to a decreasing degree over the last two years of the study. Interest in using a mobile device for everyday banking has increased, but usage for retail store payments still remains anemic.
In addition to providing insight into the growth of digital engagement, the study also uncovered drivers of consumer behavior and information around consumer preferences for payment and communication methods. Other key findings included:
- Debit continues to be the most preferred payment type among U.S. consumers, but usage continues to decline. Of those surveyed, 41% of consumers prefer debit cards, down from 43% in 2014 and 49% in 2013. Credit card preference held steady at 35%.
- 50% of survey respondents said that they have installed a mobile app from their bank or credit union. Of those who installed the app, 70% said that they use the app ‘a few times a month or more’ (net 35% of all consumers).
- Only 7% of consumers surveyed had made a payment at a retail location with their smartphone, down from 9% in 2014.
- When interacting with their bank or credit union, email is the most preferred channel of communication, with 46% preferring email communication from their financial services provider regarding purchase transactions.
- When asked about the frequency of getting marketing and special offers, 43% of respondents reported that they would prefer to receive these communications once a month.
Payment Preferences Continue to Evolve
Of the survey respondents, 82% said that the debit card they use most comes from a bank. 16% said that their primary debit card comes from a credit union. Of those with a debit card, 51% percent answered that they also had a credit card from the same financial institution. According to TSYS, “This (distribution) indicates that there remains a large market of existing customers that financial institutions can target to increase credit card penetration.”
Thirty-five percent of the respondents indicated they had at least one prepaid card, with 78% indicating that they had a PayPal account or used another online payment platform.
Debit cards were the most preferred payment type, although there was a downward trend in those who preferred debit this past year, similar to the trend seen the previous two years. What’s behind this dip in debit popularity? “The reduction in debit appears to be due to respondents preferring cash and PayPal or other alternative payments at a higher rate than that of last year’s study,” the survey stated.
Another factor that could be influencing debit’s popularity is consumers’ feelings about payment security. When asked which payment form they feel safest using for online purchases, 34% cited credit cards, 28% said PayPal, and only 17% cited debit cards. Asked the same question regarding in-store purchases, 38% said cash, 27% said credit cards and 24% said debit cards.
Income, age, and merchant type also affect payment preferences. The income segments earning $75,000 or less annually all preferred debit, while those with incomes above $75,000 preferred credit. In terms of the number of credit cards per income bracket, individuals with higher incomes owned more credit cards than those in lower income brackets.
Aligned with other payment studies, heavy majorities of consumers up to age 34 prefer debit over credit, as did those in the 45-to-54-year-old age group (43% favoring debit versus 32% for credit). The 18-24 age group also preferred PayPal or other alternative payment methods.
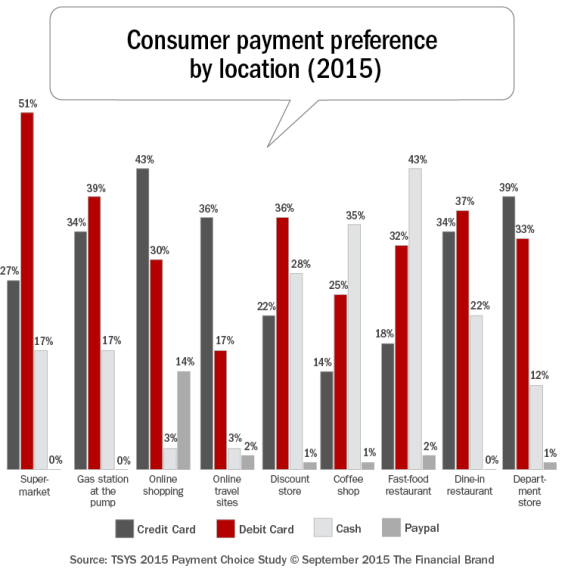
While the results from the 2015 TSYS research reflected some changes in payment preference, consumers continue to prefer to use debit when making everyday purchases, credit when shopping online or making discretionary purchases, and cash when making small dollar payments. For financial marketers, these preferences are important in developing offers and when integrating geo-targeted marketing.
Mobile Banking Increasing …
Mobile banking apps continue to be both highly adopted and frequently used. The emphasis on digital technology and mobile engagement is expected to continue as innovation increases and new products become available to consumers.
According to the survey, 50% of respondents said that they have installed a mobile app from their bank or credit union. Of those who installed the app, 70% said that they use the app ‘a few times a month or more’ (net 35% of all consumers). There is obviously great deal of room for improvement.
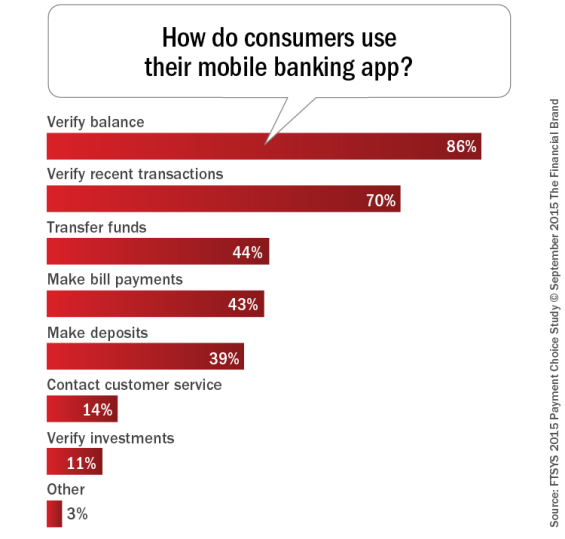
While 86% of consumers who use a mobile banking app frequently use it to verify their account balance and 70% view recent transactions on their phone, the level of engagement drops significantly from there. Again, there is a significant upside if banks and credit unions can encourage consumers to transfer funds, make deposits and pay friends and family using their phone.
… While Mobile Payments Have Dropped
Products that allow consumers to integrate payment and financial management activities on mobile devices are being introduced by both traditional and non-traditional payment companies. But, while the ability to use mobile phones for payments continues to be a hot topic in the industry, consumers remain very timid when it comes to using a phone to make an actual purchase at the point of sale.
Presented with a dozen options stating how consumers could use mobile devices for payment-related activities, ‘using your phone instead of a payment card to make purchases when checking out of a store’ ranked tenth, cited by only 26% of respondents. The No. 1 option, cited by 54% of respondents, was using a phone to stop a transaction that the consumer hadn’t made, ahead of ‘being able to instantly view transactions’ (43%), ‘turning card on and off’ (34%), ‘keeping rewards cards all in one place’ (34%), and ‘transfer money to friend or family’ (31%).
“Respondents indicating they had made a mobile payment at a POS location in 2015 actually decreased from the 9% of survey respondents who did a mobile POS payment in 2014.”
Despite the requirement that survey respondents have both a debit and credit card (used to non-cash payments), only 7% of consumers surveyed had made a payment at a retail location with their smartphone. This is despite 10% of these consumers saying they had already loaded their debit card information into their mobile device or in an app for the purpose of making purchases and 8% already having loaded credit card information. (The survey did not specify if the purchase was to be made online or in store)
Interestingly, the percentage of respondents indicating they had made a mobile payment at a POS location actually decreased from the 9% of survey respondents who said they made a payment via a mobile device at a retail location in the 2014 Consumer Payment Choice Study. Converting the non-believers may be difficult, with 46% of respondents saying they would never or are not likely to load their debit card or their credit card information onto their mobile device to make a purchase.
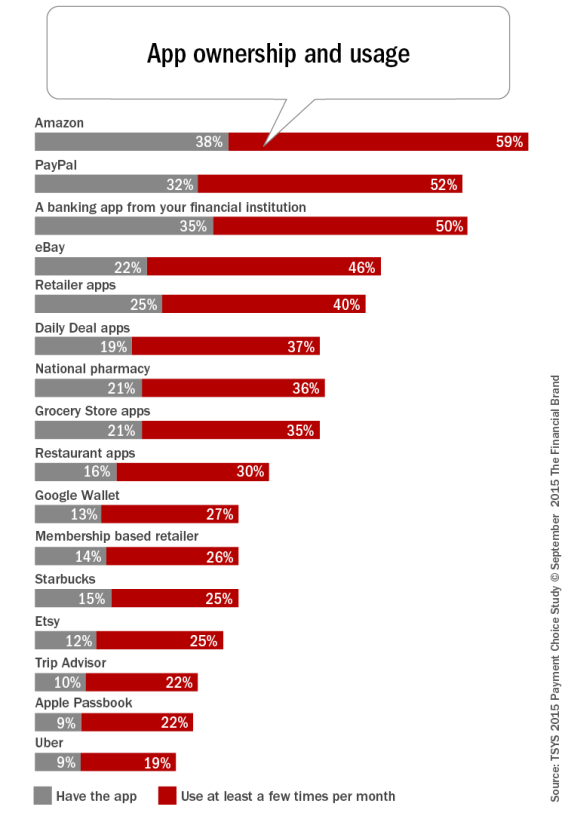
Despite the low current volume of mobile purchases, TSYS predicts that growth in the sector will continue as more mobile apps and mobile-payment options become available and are used by consumers (such as Amazon, Paypal, etc.). “We expect the emphasis on digital engagement and technology to continue as innovation increases and new products become available to consumers,” said John Dale Hester, group executive of Relationship Management at TSYS. “Providing a more robust customer experience and expanded consumer choices will help drive progress and innovation within the payments industry.”
The survey also found:
- 14% of survey respondents pay most often with PayPal on online shopping sites.
- 32% have the PayPal app on their smartphones and 52% of them use the app at least a few times per month.
- 18% of survey respondents are interested in using a wearable device, such as a smart watch, to make a payment. The survey did not specify if the purchase was to be made online or in store.
- 29% are interested in receiving instant offers and promotions for the store they are visiting on a mobile device
Marketing Communication Preferences
TSYS also included questions regarding how often consumers would like to receive communication from their financial institution, through which channels, and whether consumers are open to providing their bank or credit union information about their purchase behavior in order to provide coupons and special offers. The answers provide insight into how consumers would most like to engage with their financial institution.
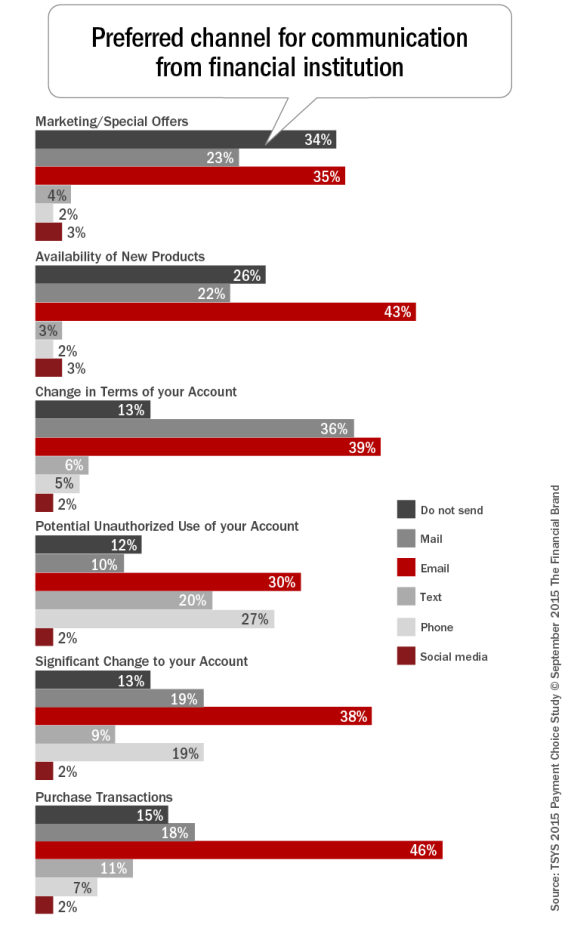
As shown above, email ranked as the most preferred channel of communication in every category across six communication types, including marketing/special offers, availability of new products, changes in account terms (interest rate, fees, etc.) significant account changes (address change, new card request, etc.), potential unauthorized use and purchase transactions.
Mobile, either by text or phone, ranked on the lower end of every communication category, except for any potentially unauthorized use of a financial account. When faced with this potential security risk, 27% of consumers said they would like to be contacted by phone and 20% of consumers would like to be contact by text. The lower ranking of mobile as a communications option may be due, in part, to the poor marketing of the benefits of this option by financial institutions.
Social media is the least preferred method of communication across the board, with no more than 2% to 3% of consumers preferring social media communication at any given time and in any given category.
When asked about frequency of communication, almost half of respondents (43%) stated they would prefer to receive special offers and marketing communication from their banks once a month, with 20% of consumers preferring weekly communication. Interestingly, 12% of consumers never want to receive a special offer from their bank, with 5% of respondents saying they’d appreciate to be contacted annually.
As with the low ranking of mobile channels for communication, the low frequency desired by consumers most likely is a result of poorly managed marketing campaigns experienced in the past, with bad targeting, incorrect channels, and poor offer design being the culprit. Illustrating the importance of contextual personalization in marketing., 60% of respondents said they were open to receiving coupons or special offers based on purchase behavior and data collected by financial institutions.
About the Report
TSYS surveyed more than 1,000 consumers who owned a debit card and a credit card for the study. Half of respondents were men and 50% were women. Survey demographics were geographically proportionate by region. Primary debit card relationships were mainly with banks (82%) followed by credit unions (16%). 51% percent of respondents had a credit card provided by the same institution that provided their debit card.
Some questions required consumers to rank-order their responses according to their relative value. In these instances,
response choices were presented at random to prevent undue influence on response data.
Please Note: TSYS does not advertise on The Financial Brand, and no compensation nor consideration was given to publish this story or provide the download link.