In spite of the flood of articles predicting the end of branches, once more I have to conclude that branches aren’t going away, and that they can even do well.
In recent posts I’ve been looking at the health of bank branches through the filter of the FDIC Share of Deposits database reports. In this article I’ll be looking at new branches, what the industry calls “de novos,” which, in Latin, means “from the new.”
Taking a Reading of the Population of New Bank Branches
First, let’s look at how many de novos have been built. There are many types of branches — manned drive ups, loan production offices, etc. — that require a branch charter. For this article, I’ll only be looking at two types, traditional and in-store (branch service types 11 and 12).
In the last five years of FDIC reporting, there have been nearly 4,800 de novo branches built. Just to be clear, I’ve excluded relocations where a new branch shows up but has historical deposits. We’re only dealing with truly new branches. When looking at deposit balances, I’ve also taken the liberty to exclude branches that quickly hit $500 million in deposits, as such rapid growth is likely due to some movement of large corporate deposits.
So, of the 4,786 branches that I analyzed, 98% were traditional formats. In-store branches are still being built in limited numbers, but total in-store levels continue a steep decline as bankers increasingly realize their limited profitability opportunity. By my estimates, one out of two in-store branches generate losses on a direct basis, versus only 1 out of 6 traditional branches doing so.
Read More: Do People Want to Visit Branches? Not When Digital Channels Work
Digging into Branch Growth Patterns Reveals Impact of Stimulus
Using the FDIC Share of Deposits file’s “branch established date” field, I was able to calculate how many months and days these new branches had been open. Over the five-year period, an average of 80 new traditional-format branches opened each month. Using the June 30, 2021, reported deposit levels, we can determine how the length of time open impacts branch deposits.
The pattern we see should seem familiar to anyone who has studied branch trends over time.
What to Watch:
Deposits grow rapidly at first, but they begin to level off toward more normal growth around five years after opening.
That said, I see something else in the figures: De novo branches have been averaging over $30 million in deposits within 12-18 months.
Historically, those are very high levels. The traditional view is that if new branches gather at least $1 million per month in new deposits they will be successful. At that deposit growth level, de novo branches should reach breakeven in the third year of operation. And they should pay back the bank’s investment before the end of five years.
These de novo branches are averaging nearly double that deposit-growth level.
The reason for these massive deposit growth levels is simple. Thank Washington. Massive federal stimulus bills pumped over $2 trillion into the economy to help the country through the Covid-driven recession. This included three rounds of stimulus checks, under the CARES Act, the Consolidated Appropriations Act, and the American Rescue Plan.
To illustrate the impact, Federal Reserve studies show that about 25% of the first stimulus round went to savings, as did nearly 40% of the second stimulus round. My analysis found that the influx of deposits doubled the year-over-year branch deposits growth rates from the previous year’s growth levels.
On the following chart, the blue bars represent the number of new branches that opened that month. The red line is the average total deposits for the June report date. The dashed line is the trendline.
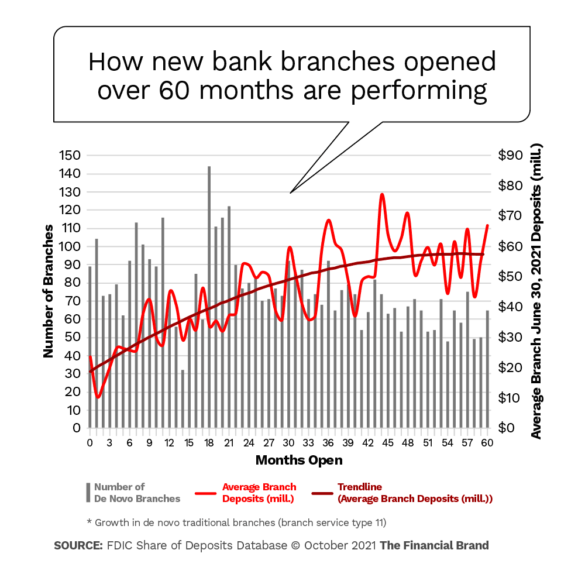
One other interesting data point to note is that the number of de novo branches opened in the last 20 months actually increased from the period four or five years ago, with some exceptions during Covid lockdowns.
What to Watch:
The trend begs the question, “If branches are going away, then why are firms still building new ones?” The answer is simple. Because consumers and small businesses still want them.
Read More: Out of Sight, Out of Mind: Why Branches Still Matter
Separating New Branches by Distinguishing Characteristics
With more stimulus checks being unlikely, some kind of normality is returning to new branches’ deposit gathering. Within the data set there is wide variability, as not all de novos are the same. Some are traditional freestanding buildings in grocery-anchored shopping centers (the best) and others are smaller storefront sites in various types of centers. The location your institution chooses, and the site you choose (i.e., the building) make all the difference in the world in performance and deposit growth.
So does the market you build in. In total, the de novos analyzed here were built in 162 different metro areas, so opportunity is seen in many parts of the country.
Performance of new branches in markets leading markets for de novo expansion
| CBSA* Metro Area | De Novos | % of De Novos |
Avg. # of months opened |
Avg. deposits (millions) |
Avg. deposits per month (millions) |
|---|---|---|---|---|---|
| Non-CBSA Rural Areas | 999 | 21.4% | 29 | $35.8 | $1.2 |
| New York Newark, NY-NJ-CT-PA |
300 | 6.4% | 34 | $70.0 | $2.1 |
| Boston Worcester Providence, MA-RI-NH-CT |
181 | 3.9% | 24 | $41.2 | $1.7 |
| Houston The Woodlands, TX |
168 | 3.6% | 24 | $35.4 | $1.4 |
| Dallas Fort Worth, TX-OK |
161 | 3.4% | 29 | $59.6 | $2.1 |
| Washington Baltimore Arlington, DC-MD-VA-WV-PA |
145 | 3.1% | 25 | $51.4 | $2.1 |
| Los Angeles Long Beach, CA |
132 | 2.8% | 33 | $82.9 | $2.5 |
| Philadelphia Reading Camden, PA-NJ-DE-MD |
123 | 2.6% | 26 | $43.5 | $1.7 |
| Atlanta Athens Clarke County Sandy Springs, GA-AL |
113 | 2.4% | 25 | $41.4 | $1.6 |
| Miami Port St. Lucie Fort Lauderdale, FL |
108 | 2.3% | 31 | $58.5 | $1.9 |
Source: FDIC Share of Deposits Database. * Core-Based Statistical Areas
I find it fascinating that 21% of all de novos were built outside of metro areas, even though these areas generally offer less demand due to low population levels. But even in those rural markets, they have been averaging more than $1 million in deposit growth per month. Thank you, stimulus! New York, Dallas, Washington, D.C., and Los Angeles all averaging more than $2 million per month deposit growth.
Points Consumers Bankers Must Ponder in Network Decisions
Retail banking planners must start thinking about these trends for the longer term. A couple of bullets to guide their discussions:
- Branches aren’t going away anytime soon, although their numbers are declining slightly.
- Many banks are still building de novos as they infill and reposition their branch networks.
- The stimulus packages have flooded branches with deposits. Stimulus infusions won’t likely continue, so everyone needs a plan B.
- There are many markets with opportunity to support de novo branches but planners must pick their markets carefully as their characteristics impact performance significantly.
- Location and site considerations are also important, with in-store branches being a strong example of a “good location” but a “poor site.”