JD Power recently conducted a webinar releasing the first wave of its 2015 bank customer satisfaction research. Overall, there are a lot of interesting data points in the deck, which you should check out. Two particular areas stood out for me.
JD Power breaks its findings into three categories: big banks, regional banks, and mid-sized banks. Since 2010, average customer satisfaction scores for all three categories have increased. Mid-sized banks continue to lead the pack, with an average of 802.
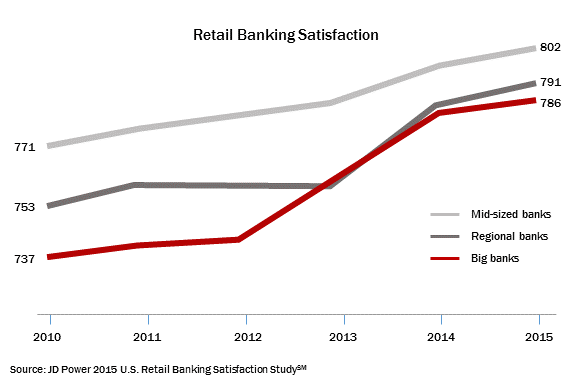
To put this in perspective, 802 isn’t as good as the overall score for auto insurance claims (847), but it exceeds overall satisfaction with credit cards (778) and electric utility providers (677).
Mid-sized banks will no doubt crow about their higher score (as do the credit unions when they get rated higher on satisfaction and trust surveys), which I refer to as the “Sally Field moment.”
But are the differences in the scores really that meaningful?
In 2010, the difference in scores between mid-sized bank and big banks was 34 points, or about 4.4% of the mid-sized banks’ score of 771. Fast forward to 2015, and that gap has shrunk considerably. Mid-sized banks have just a 16-point lead on big banks, a 2% differential.
In 2010, the gap between regional banks and big banks was 16 points.Today, the gap has declined to just five points, a 0.6% differential.
[nativeads[
What happened over the past five years?
1) Big banks got better. I know this is really hard for some of you to admit and accept. But coming off the depths of the financial crisis, big banks had their “come to the J-man” moments and made organizational changes to fix things, invest in new technologies, and, well…make things better. They’re still far–far–from perfect, but they’ve improved. Hell, maybe even the CFPB can take some of the credit.
2) Gen Yers grew up. Not all of them, of course. But the “I’m-going-to-right-all-the-wrongs-in-the-world-starting-with-eliminating-big-banks” 25 year-olds of 2010, are the “Damn-I-need-to-save-more-for-a-down-payment-and-a-new-car-and-my-new-kid’s-college-education” 30 year-olds of 2015.
3) The economy improved. Maybe not by a whole helluva lot, but one thing I’ve suspected for a long time is that levels of customer satisfaction with banks reflect, to a certain degree, the state of the economy, which has a huge impact, of course, on people’s financial lives. If their financial situations improve, then they’re more likely to be more satisfied with their banks. And I have research to prove that between 2010 and 2013, many consumers perceived their financial health to be in better shape.
Bottom line #1: The Bank Transfer Day moment has come and gone. Big bank bashing is simply not an effective strategy for 2015.
The other data point that caught my attention was one regarding consumers’ intentions to recommend their banks. JD Power captured the percentage of consumers who said they would “definitely” recommend their banks, and split it out by level of satisfaction.
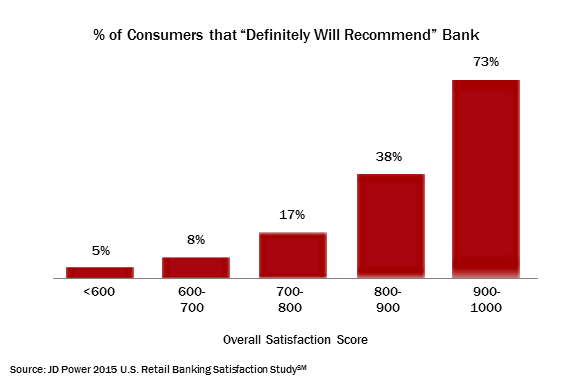
It shouldn’t be surprising to see that as level of satisfaction goes up, so does the percentage of consumers who will recommend their banks. But what might be surprising is the percentage differences between the levels. From one level to the next, the percentage of consumers recommending their bank practically doubles.
I didn’t get a chance to listen in to the webinar, so I’m really not sure how to interpret the chart above. I don’t know if it represents: 1) the percentage of a bank’s customer base, segmented by the banks’ customer satisfaction score, or 2) the percentage of consumers who will definitely recommend, based on a satisfaction score assigned to the consumer. I would guess #1, but I could be wrong.
Assuming it is #1, here’s the point: Satmetrix reports that the average Net Promoter Score for banks is just north of 30. This doesn’t jive with JD Power’s findings.
Across the three types of banks, the average customer satisfaction score is 790, which means that there has to be a lot of banks in the <800 ranges.
If the banks in the 700-800 score range only see 17% of their customers indicating a “definite” intention to recommend them–and the percentage goes down with satisfaction level–then how can banks, as a whole, be seeing a net promoter score in excess of 30?
Bottom line #2: Banks that put their faith in the wrong metric (i.e., net promoter score) may be deceiving themselves regarding their performance.