Bancography, a strategic branch planning firm, has released its annual outlook for the financial services industry, examining deposit, demographic, and economic trends across the U.S.
Over the last four years, Bancography found credit unions saw 16.3% deposit growth. Community banks outpaced them slightly, with 16.9%.
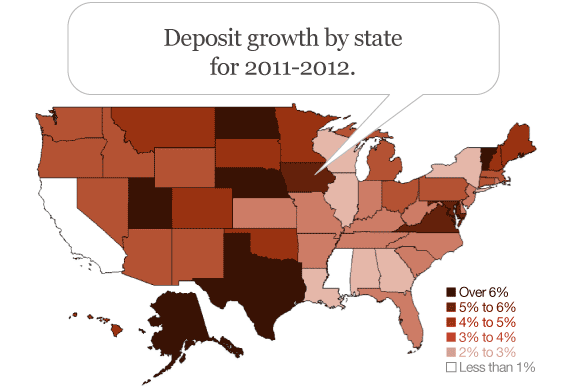
In 2012, the big four national U.S. national banks — BofA, Wells Fargo, Citi and Chase — saw deposits grow by 3.9%, while growth at credit unions was 3.8%, followed by community banks at 2.7%. Regional banks suffered, losing 0.8% of their deposits last year.
| Type of Financial Institution | Deposit Growth 2011-2012 |
Four-Year Deposit Growth |
|---|---|---|
| Community banks | 2.7% | 16.9% |
| Credit unions | 3.8% | 16.3% |
| Super-regional banks | 1.7% | 8.1% |
| National banks | 3.9% | 7.6% |
| Super-community banks | 1.2% | 5.7% |
| Regional banks | -0.8% | 5.5% |
Bancography’s full 40-page report includes 20 graphs, 5 maps, 3 charts and 2 tables. Every senior executive in the retail financial industry should find something of value in this report.
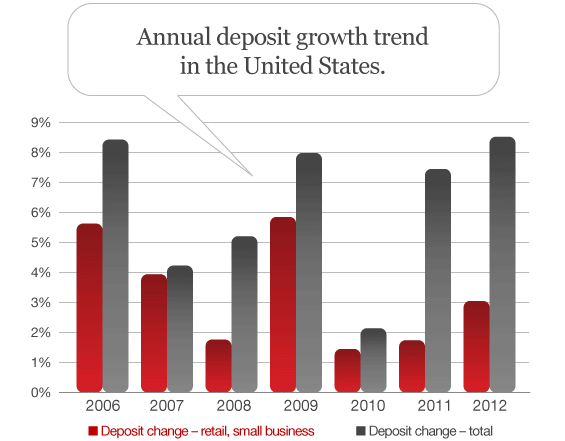
National Deposit Growth Trends
Since the ‘flight to quality’ boon that followed the 2008 economic crisis, consumer and small business deposit growth has remained low, though 2012 saw some rebound from the lows of 2010 and 2011. In contrast, institutional balances increased substantially in 2011 and 2012 as large corporations parked cash in financial institutions, hesitant to invest in a slow economy.
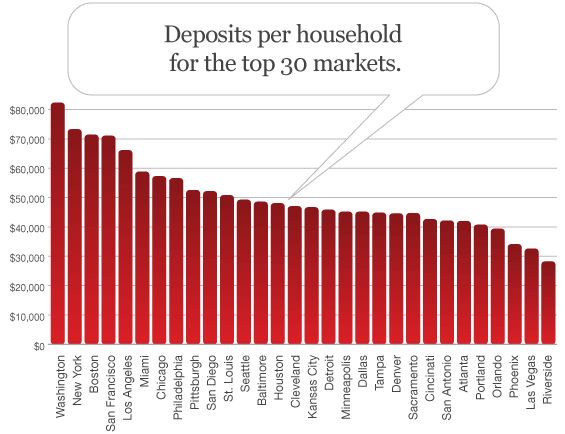
Deposits Per Household
The largest, long established metros such as Washington, New York, Boston, San Francisco, and Los Angeles show higher deposits per household than newer markets such as Orlando, Phoenix, Las Vegas and Riverside.
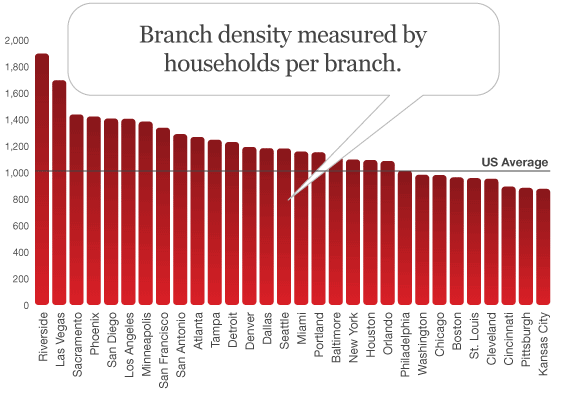
Branch Concentration
Long-established markets in the Northeast and Midwest are more concentrated, with one branch for every 900 to 1,000 households. California and other Western metros remain less concentrated; many contain only one branch for every 1,500 households.
About 88% of U.S. banks left their branch networks unchanged last year. Of those banks that adjusted their network size, slightly more reduced branches than added branches. There were 7,244 banks in Bancography’s study; 457 said they reduced the size of their branch network last year (6.3%), while 437 said they added branches (6.0%).
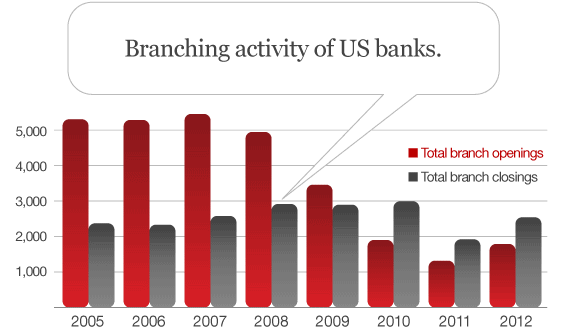
The inventory of branches in the U.S. has declined by almost 2,000 units over the past three years, including a decline of 750 units in 2012. However, the pace of new branch opens revived from 2011 lows last year, even as the pace of closes increased by a greater degree.
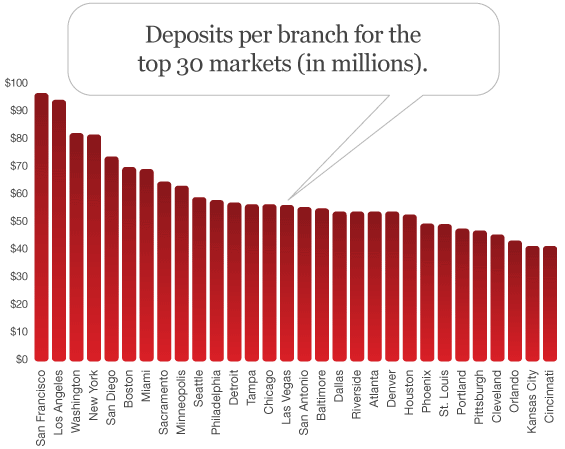
With their greater aggregate wealth, large markets capture most of the top spots in a ranking of deposits per branch. San Jose, Raleigh, Honolulu, Ogden and Oxnard — all high income communities — are examples of coastal, smaller markets that reach into the top rankings.